Table of Contents
Overview
This is a translated version of the Original Blog Written by Jiyun Ko
Cantor once said, “The essence of mathematics lies in its freedom.” (Das Wesen der Mathematik liegt in ihrer Freiheit)
This is the famous statement of Georg Cantor, the founder of set theory, which forms the foundation of modern mathematics.
But what does freedom in mathematics actually mean? Does it mean mathematics itself is free? That sounds absurd altogether. So, are we freeing math from some chains? Not quite.
Even in mathematics which is often seen as the pinnacle of logical rigor, the standards we rely on aren’t divine laws. These are frameworks that humans over time have collectively agreed to use. As long as the logic holds, mathematics becomes a space you can shape and explore freely.
That’s the spirit of the MathDesigner classroom. Students are encouraged to imagine without constraints, play with ideas, and discover solutions with a sense of joy and curiosity. For us, it’s not just about teaching math. It’s about creating art through mathematics and equally discovering mathematics through art.
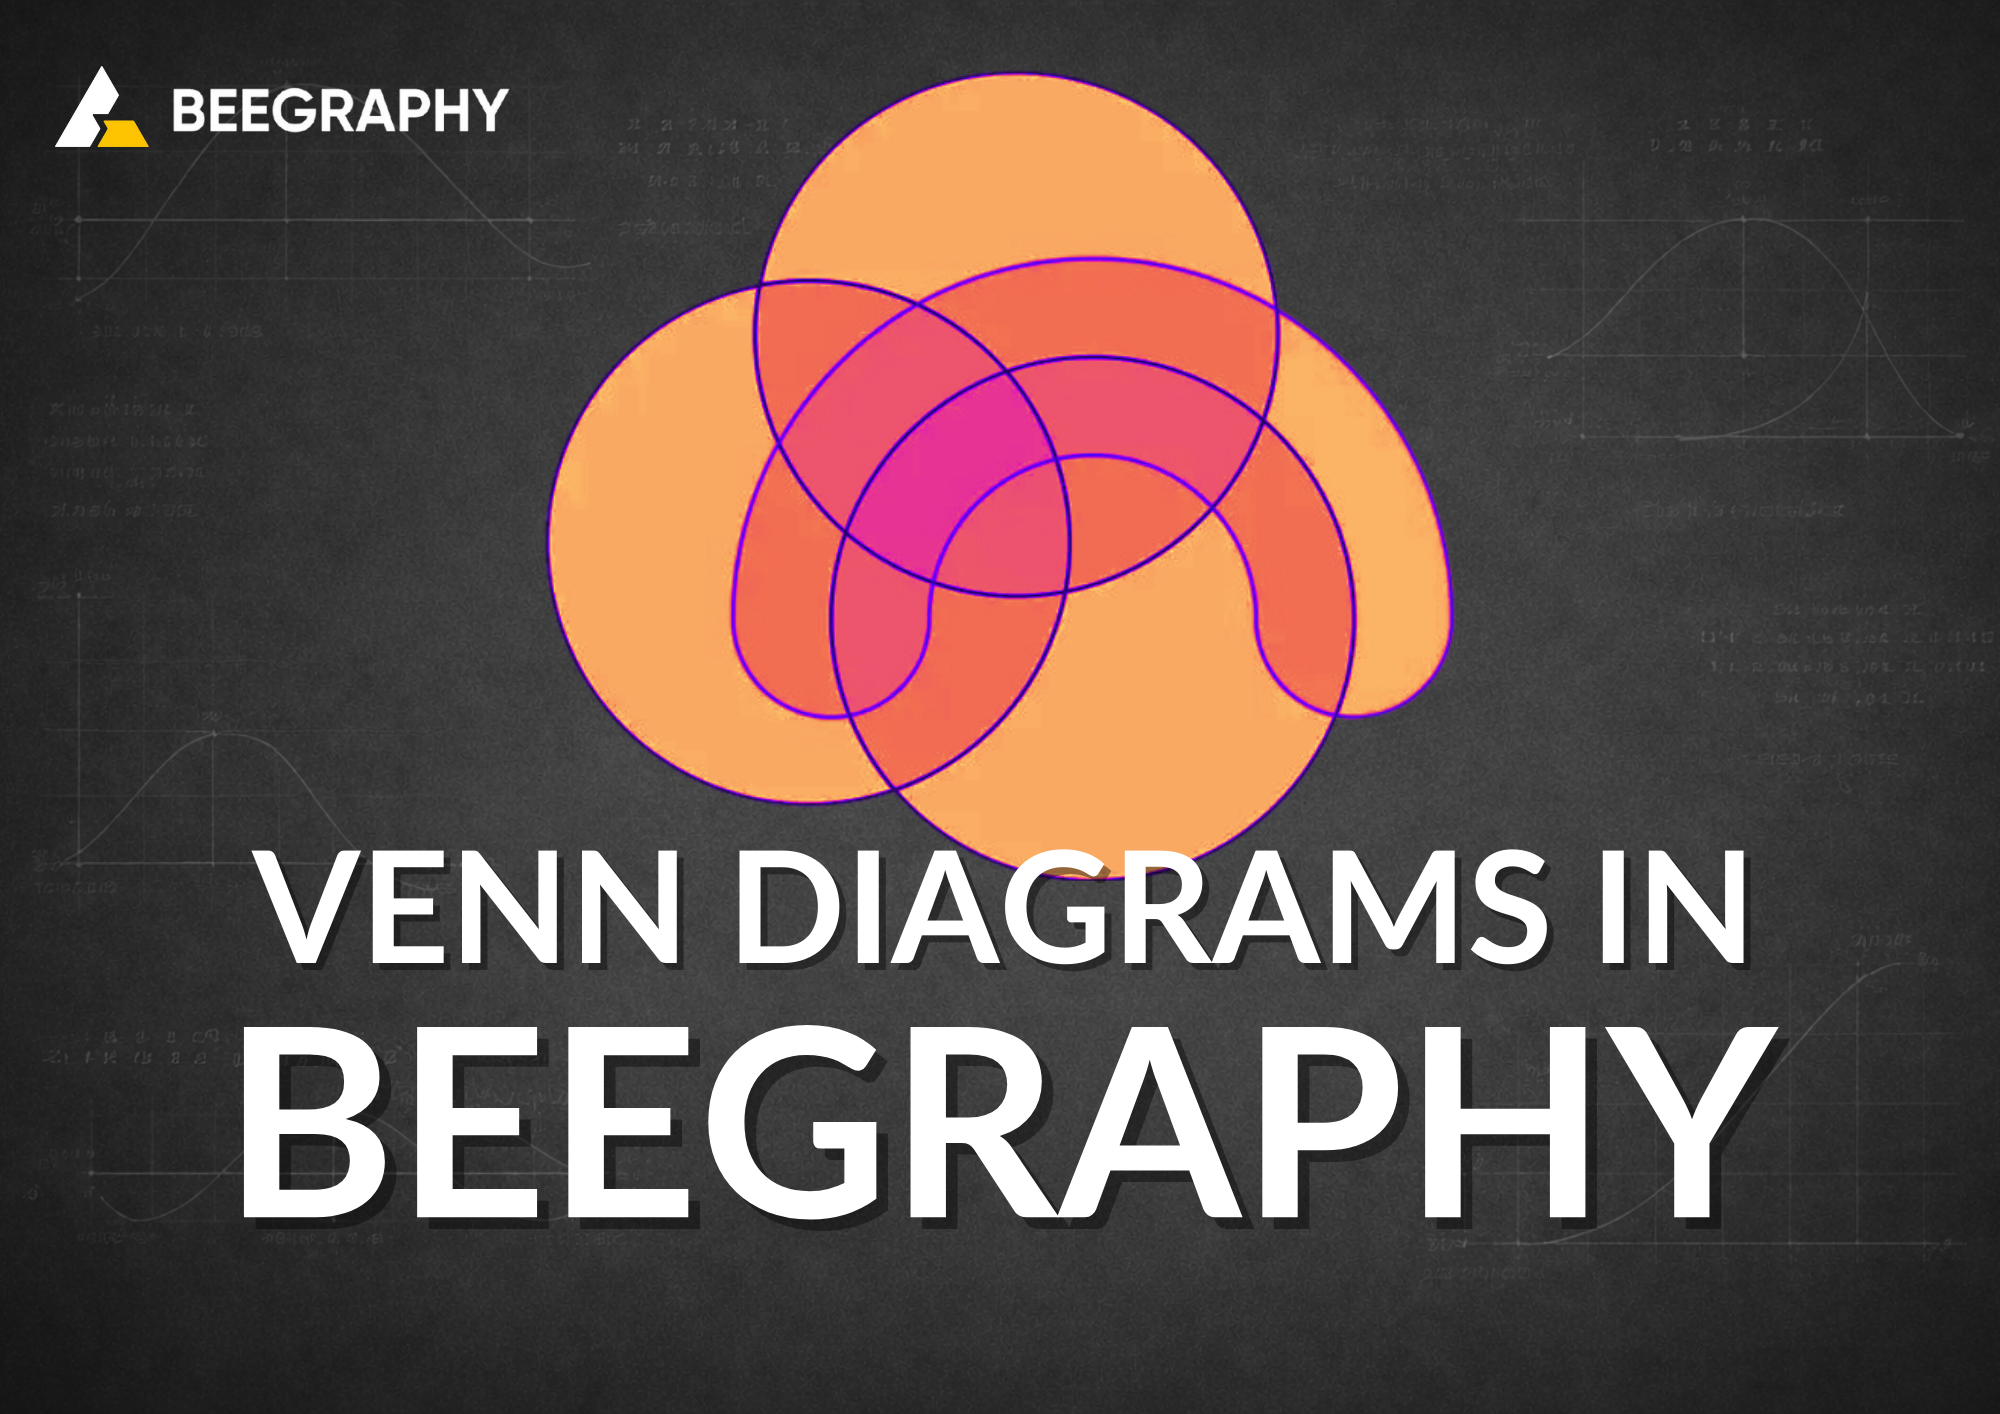
Integrating Venn Diagrams with BeeGraphy
In this lesson, we use BeeGraphy to understand the principles behind Venn diagrams.
Venn diagrams form the fundamentals in set theory. Introduced by John Venn in 1880, Venn diagrams were a new way to represent sets.
Venn diagrams consist of multiple overlapping circles. Each circle represents a set. (A set is an unordered collection of distinct elements.)
For example, let
- Set A = {1, 2, 3, 4}
- Set B = {2, 4, 5}
Here, 2 and 4 belong to both set A and set B.
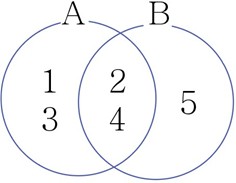 Let one circle be A, and B as another ,then the shared elements: 2 and 4, appear in the overlapping region. With just a couple of circles, anyone can grasp how sets relate to each other at a glance.
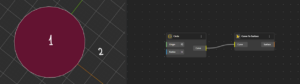
If there is one circle, how many regions does it represent? The answer is 2!
- Inside the circle
- Outside the circle
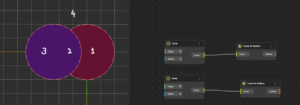
Add another circle, so now we have two sets, and the number of regions jumps to four. Ding-dong-dang, exactly.
So, what happens as the number of sets (circles) increases?
The number of regions created by n sets is given by = 2^n (where n is the number of sets).
For example:
1 set → 2^1=2 regions (inside the set, outside the set)
2 sets → 2^2 = 4 regions (all combinations of inside/outside for the two sets)
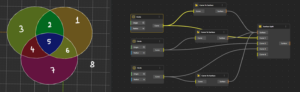
3 sets → 2^3 = 8 regions
4 sets → 2^4 = 16 regions
and so on…
So, as the number of sets increases, the required regions grow exponentially.
Extending Venn Diagrams Beyond Three Sets
It is easy to draw a Venn diagram for three sets, but what happens when we increase the number of sets? How do we visualize those without the diagram turning into chaos? That’s where BeeGraphy becomes useful.
The method is simple.
Start with a standard 3-set Venn diagram. Place one point in each region, then connect those points in a way that doesn’t overlap or repeat any connections. The result looks a bit unusual at first—but that strange-looking shape is exactly what becomes a 4-set Venn diagram.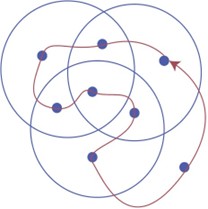
Pretty wild, right?
The Geometric Limitations of 4-Circle Venn Diagrams
With 2 or 3 circles, counting the regions in a Venn diagram is easy because students can see them. But with 4 circles, there are 24 = 16 regions, some of which are hidden or irregularly shaped. Counting them by eye becomes tricky.
When students try to draw a 4-circle Venn diagram, it looks simple at first — “just add one more circle!”
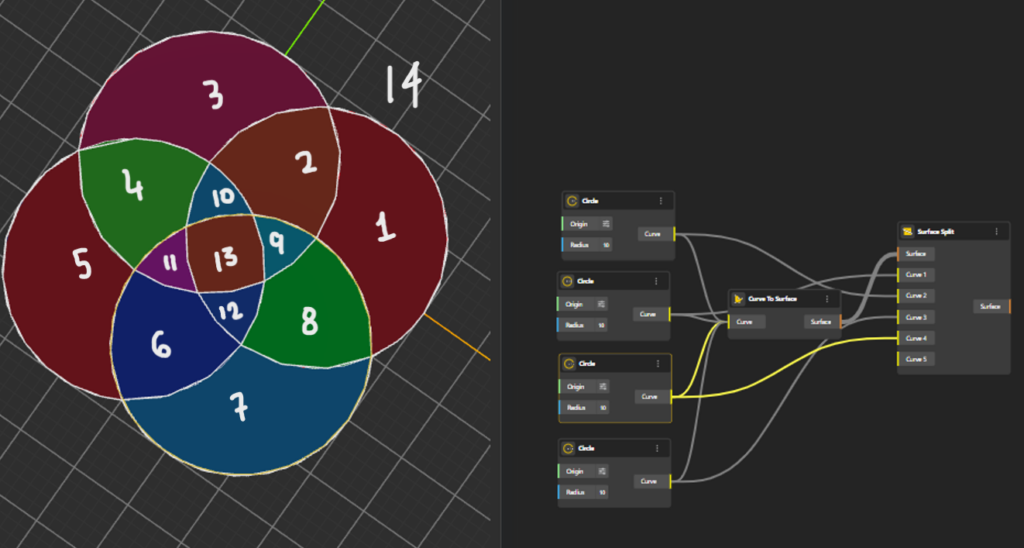
But this is where most students get stuck. A student may try many different arrangements of four circles, and some of them look correct. The diagram might look nicely symmetrical, or aesthetically pleasing, but when you actually count the regions, you only get 14 or 15 instead of the required 16.
Why does this happen?
This happens as four perfect circles cannot all intersect each other in the right way.
- Some circles do not intersect another circle twice.
- Some intersections overlap incorrectly.
- Some regions merge together without the student noticing.
This is why drawing 4 perfect circles simply does not work.
For a true 4-set Venn diagram, every one of the 16 combinations (inside/outside of A, B, C, and D) must exist as a separate region.
Venn’s Approach to the 4-Set Diagram
Mathematicians realized long ago that it is impossible to get a proper 4-set Venn diagram using only four perfect circles. So the best way to go about it is:
- Start with a 3-circle Venn diagram: It already has 8 regions.
- Place a centroid in each region: Students put a little dot inside every region so none are missed.
- Now add the 4th set as a “balloon-animal” shape: This shape moves around the 3-circle diagram and:
- passes through each centroid exactly once
- divides each of the 8 regions into two, resulting in 16 total regions
This shape is not a perfect circle, it is long and looping. But mathematically, it can result in a proper 4-set Venn diagram.
Why does this work?
The curved shape ensures:
- every existing region gets split
- no region is skipped
- no regions merge incorrectly
So the student gets the correct 16-region Venn diagram every time.
Here are a few blogs to check out if you’re interested further in this theory:
Why you can’t make a Venn Diagram with 4 Circles
Why can’t we draw a Venn diagram for 4 sets with circles, and how can we solve it?
Constructing a 4-Circle Venn Diagram Using BeeGraphy
Now, let’s recreate this structure using BeeGraphy.
Why BeeGraphy?
Because once students build it themselves, they actually feel the beauty of the idea. It turns a dry concept into a hands-on experience.
Applying Design Thinking to Mathematical Visualization
Let’s organize this problem-solving process using the stages of design thinking. We’ll begin with the first stage:
- Define: We ask ourselves, “How can we effectively visualize four or more sets?” This helps students to start exploring different approaches, thinking beyond textbooks.
- Ideate: For three circles, they place a point in each region (using the Centroid nodeblock), index the points, and connect them in sequence. The key is making sure the lines don’t overlap and that the curve passes through every region exactly once. By working through this, students naturally arrive at the general idea behind counting the maximum number of regions formed when a plane is divided. The discovery emerges through the process and not memorization.
- Prototype: Using BeeGraphy’s nodeblocks – Circle, Curve to Surface, Centroid, List Item, and others – students build their own versions of the diagram, test them, refine them, and iterate.
Visualizing Mathematics Through Parametric Design
By using parametric learning, learners can represent mathematics visually. That means, they are able to interact with a visual representation of a mathematical problem. When we integrate parametric design methodology, students are able to observe what perturbations occur in the mathematical formation while solving problems. As a result, they are better equipped to work with geometry, algebra, and above all to think creatively while using mathematical logic on their own. Their comprehension grows due to metacognitive awareness and visualization. This is BeeGraphy’s strength.
- Converting set structures into Venn diagrams in coordinate space: Students transform abstract logical relationships into concrete, spatial forms. This “representation shift” makes logic feel tangible.
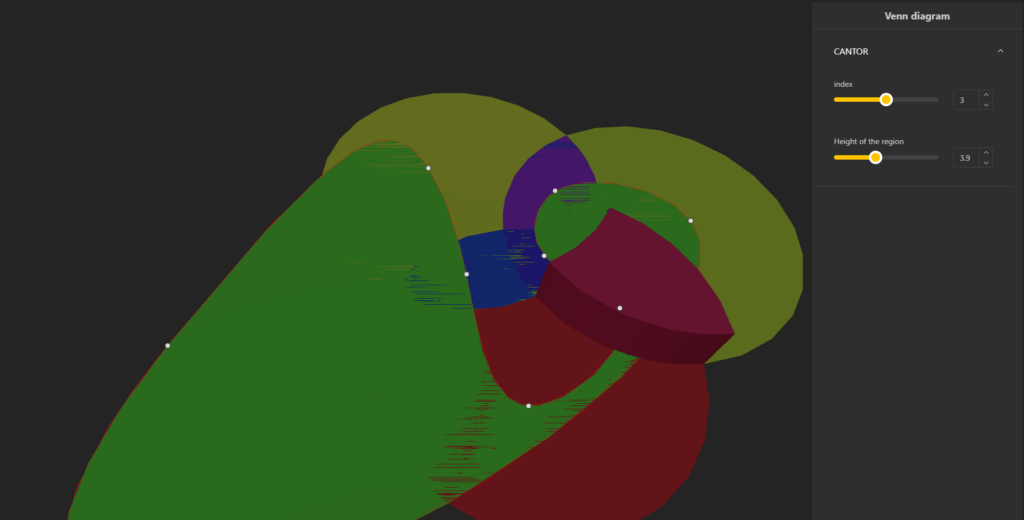
- Using height values to extend 2D regions into 3D forms: Instead of relying on color, students give each region a vertical value—making the diagram something they can perceive physically and intuitively.
- Applying parametric design to adjust the number of sets: By manipulating the input values, they rebuild complex logical relationships as mathematical rules they can see and understand directly.
Parametric design in math education allows students to instantly observe how a structure responds when inputs change. Concepts stop being static—they become dynamic models. This encourages relational thinking over rote operations.
In the process, students strengthen their ability to analyze conditions, visualize abstract ideas, and grasp structural relationships. The burden of processing complex information is reduced through visual clarity, making mathematical ideas easier to interpret at a glance.
So really, isn’t BeeGraphy a modern tool that brings the full freedom of mathematics to life?
You can try out the Demo for the above here.
Step by Step Tutorial with BeeGraphy
The step-by-step explanation for creating the structure is provided below for your reference.
Step 1: We begin making three circles and transforming them into surfaces so that we have shaded regions to work with.
Step 2: Next, we use Surface Split to divide each circle into distinct partitions. For example, if we want to distinguish the intersected region of circle A, we connect circle B and circle C to the Curve input, and circle A to the Surface input.
We repeat the steps above for circles B and C to get their distinctive intersection areas.
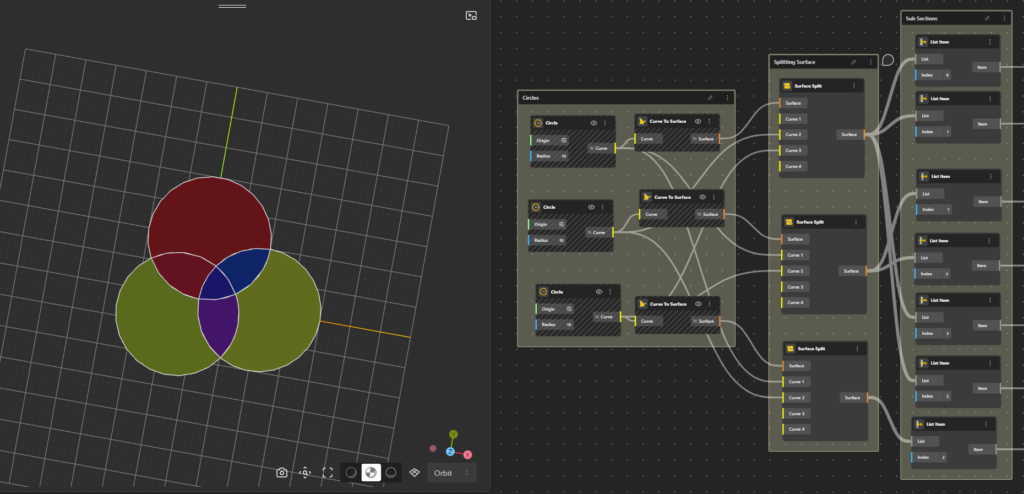
Step 3: To easily locate these sections, we use List Item and assign indices to each region. This makes it easier to find all the partitions individually.
Step 4: For every section, we compute its centroid using the Centroid node, creating a one-to-one connection between each region and its centroid. This gives us seven centroids for the seven regions formed by the three circles.
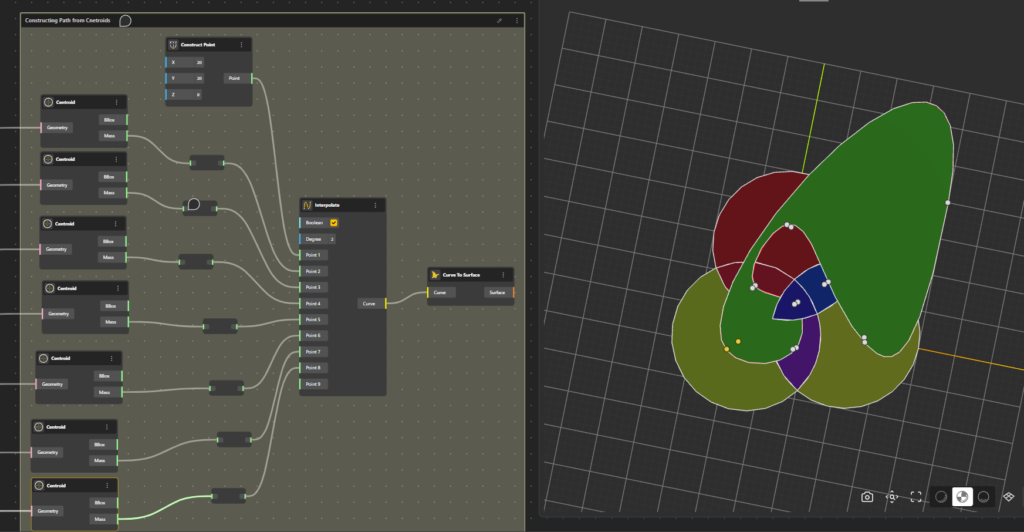
Step 5: Finally, we place an additional point outside the circles to represent the eighth region. Make sure the point is placed in such a manner, it does not overlap any region. Next, we interpolate all the points such that there is cross intersection. Thus, creating a continuous path passing through all the points and regions.
Step 6: To further interact with each region more easily, let us create a list of all the sections and connect them to the input port of the List node. To make multiple selections, hold Shift and drag a wire from the item output port into the List node.
Step 7: Now, we create the index range. Add a Range (Input) node and set:
- Min: 0
- Max: 6 (since we have 7 surfaces, the index runs from 0 to 6)
- Step Count: 1
Rename the node to Input, and connect it to the Index port.
Step 8: Add an Extrude Surface node and connect the List Item output to its Surface input. You can now freely select any region using the index range.
Step 9: To control the height of the section you want to extrude, add a Vector Z node and connect it to a Range (Input) node. This slider will allow you to choose your desired extrusion height.
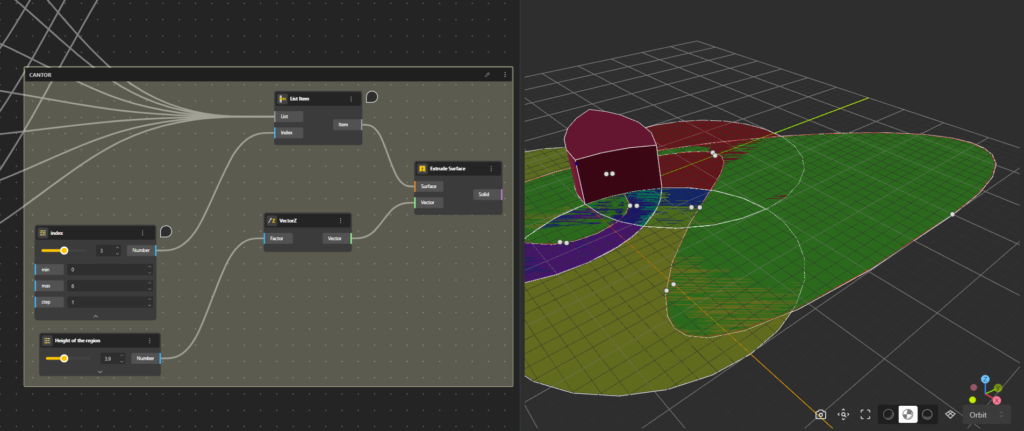
Step 10: Once everything is set up, head to Demo (top-right corner). You now have a fully interactive workspace where you can select any region and extrude it vertically to better understand its structure.
You can try out the Demo for the above here.
About Jiyun Ko (MathDesigner)
Jiyun Ko (MathDesigner) is a mathematics educator, researcher, and design-driven innovator whose work bridges mathematics, visualization, and educational technology.
She is the CEO of GoMath Academy. Previously she has been worked as a developer of patented experimental math curricula and visual problem-solving systems, and a project manager for national R&D initiatives on climate-change technologies.
With an academic background spanning mathematics, industrial design, and educational technology, she received her PhD from from Korea University, Kookmin University where her research focuses on enhancing mathematical self-efficacy and developing visualization frameworks for math education.
Her influence extends through academic research, admissions consulting, large-scale exam development, and frequent media features, including interviews across Korea and columns for Monthly Sisa News.