Table of Contents
BeeGraphy is Back with improved usability, workflow efficiency, and capabilities for both creators and businesses. We’ve rolled out several updates across the platform, from a brand-new website to powerful new nodes and developer tools, all aiming at making workflows faster, smarter, and more capable for creators and businesses!
New BeeGraphy Website
We’ve launched the new BeeGraphy website: https://beegraphy.com/
The new site introduces a more interactive experience and improved interface, making it easier to explore the platform and its capabilities.
Key additions include:
- Product Configurator for Businesses – Companies can now explore how BeeGraphy enables interactive product configuration.
- Workshops & Training Pages – Dedicated pages for learning opportunities, training sessions, and workshops are now live.
- Improved Navigation & UI – A cleaner layout and smoother browsing experience across the platform.
CAM View
CAM (Computer-Aided Manufacturing) View is a workspace within BeeGraphy that bridges the gap between design and fabrication – turning parametric models into machine-ready instructions.
What it does:
- Assigns a material and machine to your model, then generates a G-code toolpath that a CNC mill or laser cutter can directly execute
- Allows you to reassign machines, select layers, and sequence operations (e.g. engraving first, then internal cuts, then external cuts)
- Supports operations like 2D profile cutting, pocket milling, and drilling
- Handles toolpath details like dog bones, tabs, lead-in/lead-out, cut depth, step down, and safe Z height
- Includes a built-in G-code simulator to visualize rapid movements and cutting paths before sending to a machine
How it fits into the workflow:
- Designer builds the model and adds material, service, and machine nodes.
- CAM view is configured once, operations, tools, and parameters are set up.
- When a client places an order through the configurator, the manufacturer can generate and download the G-code with minimal effort, no repeat setup required.
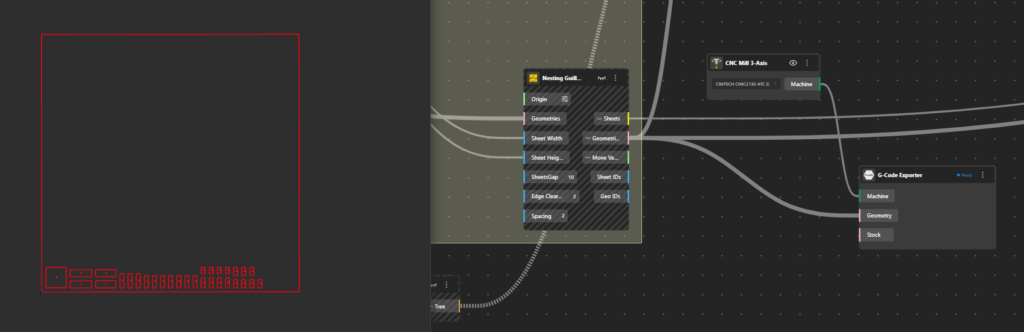
Machine Node Package
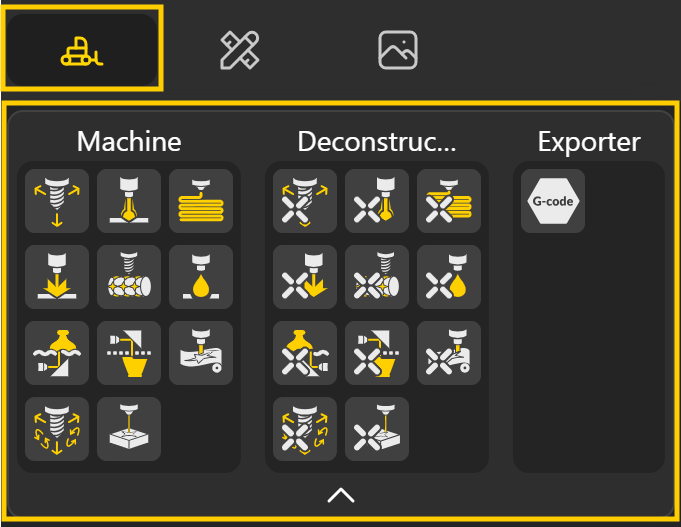
The Machine Package is a new core BeeGraphy node package containing 23 nodes across 3 groups designed to define, configure, and assign manufacturing machines directly within your BeeGraphy workflow.
It is found under Machines in the menu. It consists of 3 Groups:
- Machine: This covers a wide range of real-world fabrication equipment: including CNC Mill 3-Axis and 5-Axis, Laser Cutter-Engraver, Plasma Cutter, Waterjet Cutter, CNC Lathe, Vinyl Cutter, 3D Printer FDM, SLA, and SLS. Each machine node calculates processing parameters based on machine capabilities and input geometry.
- Deconstruct Machine: Each machine node can be deconstructed to expose its individual attributes as separate outputs such as the working area (full sheet dimensions), material source, spindle capacity, feed rates, and other parameters that were originally defined when setting up the machine. This makes it easy to reference and reuse specific machine data directly within your workflow.
- Exporter: For now, it contains only the G-Code Exporter node that ties the entire CAM workflow together by converting your toolpath into machine-ready G-code.
Main Menu Updates
Several powerful tools have been added to the Main Menu to make navigating and debugging models easier.
Active Nodes
The old Omni Search Panel is all new and improved as Active Nodes. It is added in the Main Menu that opens a dialog box showing all nodes currently active in your BeeGraphy workspace. For shortcuts use Ctrl+F or Cmd+F.
Here’s what it offers:
- Instead of hunting through a complex graph, all your nodes are listed in one place
- You can click any node in the list and it jumps straight to it.
- You check whether nodes are hidden or visible at a glance.
- Help you keep your nodes organized managing large, complex node graphs without getting lost.
Essentially it acts like a table of contents for your entire model, the bigger and more complex your model, the more useful it becomes.
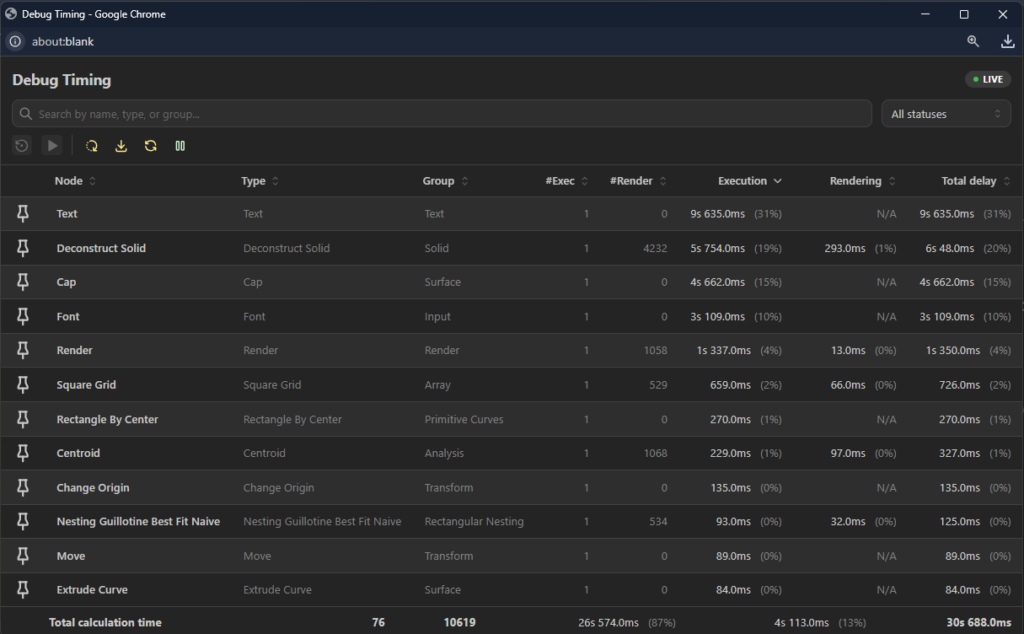
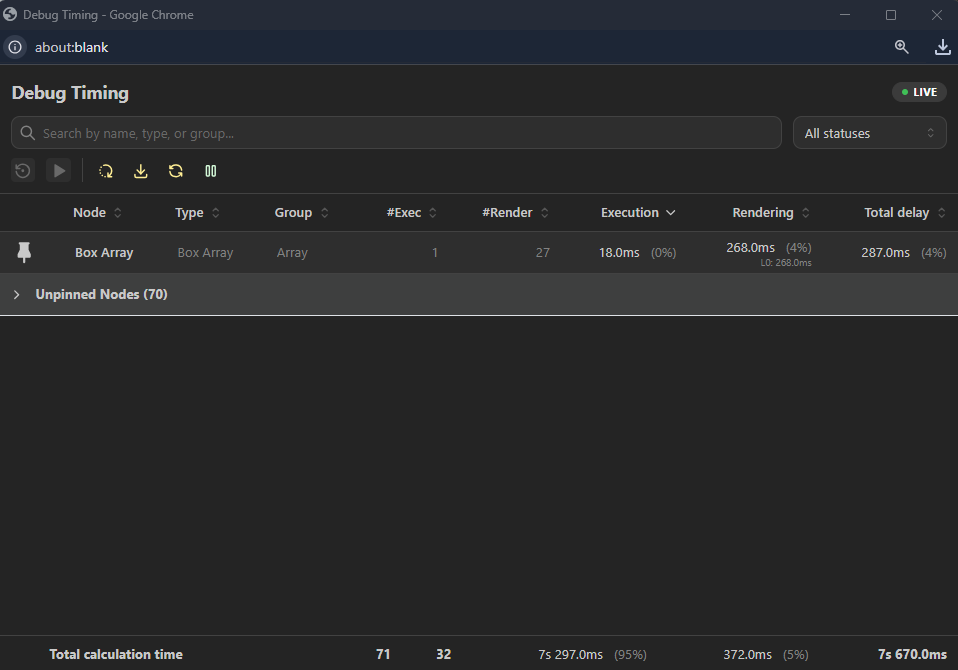
Debug Timing – Performance Insights for Models
This is a performance profiling and debugging tool for node-based model workflows. So, now every node in your workflow gets its own timing breakdown:
- Node group type: categorizes what kind of node it is, so you can compare performance across similar node types.
- Execution time: how long the node actively ran
- Rendering time: how long it took to display/output results after execution
- Total delay: any waiting time before the node even started
- Total processing time: the full end-to-end time from trigger to completion
Level of Detail (LOD) is a performance technique where the 3D engine automatically renders geometry at different levels of complexity depending on how close or far the camera is. The idea is simple, if you’re zoomed far out, there’s no need to render every fine detail, so the engine uses a simplified version to save processing power. In the timing panel, each node shows a breakdown per LOD level:
- L0: the most simplified render, used when zoomed far out. Fastest and lightest
- L1: a mid-level render, used at a moderate camera distance. Less detail, less processing time
- L2: the most detailed render, triggered when you’re zoomed in close. Heaviest on performance since the full geometry is being processed.
You can choose the LOD Settings from Main Menu → Settings → 3d Viewer. There are 4 option for Quality: Low, Medium, High and Custom.
If your model feels slow at certain zoom levels but not others, the LOD breakdown tells you exactly which detail level is causing it and which node is responsible, giving you a precise target to optimize rather than guessing. Together, these let you pinpoint exactly where bottlenecks occur, whether it’s the computation itself, the rendering, or idle waiting.
You can further filter your node view to only show nodes in a specific state. This is especially useful in large, complex graphs where dozens of nodes run simultaneously.
- All Statuses See everything at once
- Idle Nodes waiting to be triggered
- Executing Currently running
- Rendering Finished computing, now displaying output
- Error Failed during execution
Toolbar Actions
- Reset timing data: clears all recorded metrics so you can start a fresh measurement run
- Export as CSV: saves all timing data for external analysis (spreadsheets, reports, comparisons across runs)
- Run all nodes: triggers a full pipeline execution, capturing timing across every node
- Pause live updates: freezes the timing display so you can read values without them refreshing in real time
- Pin any Node: locks a specific node in view so it stays visible in the timing panel at all times
You can select any individual node and reset its timing data independently, then manually trigger just that node on demand. This is powerful because it lets you:
- Isolate and benchmark a single node without re-running the whole pipeline
- Test how a node behaves under different inputs or conditions
- Reproduce and diagnose errors on a specific node without disturbing others
Without this tool, debugging a slow or broken pipeline means guessing. With Debug Timing, you get exact, measurable data , making it straightforward to answer questions like:
- “Why is my pipeline slow?” → Check total processing time per node
- “Where is the bottleneck?” → Compare execution vs. delay times
- “Which node is crashing?” → Filter by Error status
- “Is node X slower than last time?” → Export CSV and compare runs
Interactive Geometry Selection in the Viewport
When working with complex models, multiple nodes often produce geometry outputs that overlap or coincide in the 3D viewport. Previously, figuring out which geometry belonged to which node meant digging through your graph manually. With this new feature, you can click directly on geometry in the 3D viewport and instantly switch between the outputs of different nodes at that point.
Now You can Hassle-Free:
- Debug and spot where something looks wrong and immediately identify which node is responsible
- Inspect intermediate geometry to check what a node is producing mid-pipeline, not just at the final output
- Trace back and forth through your workflow at a faster pace.
Think of it like being able to “click and ask” any geometry in your 3D viewport, Hey! Which node made you?
New Camera Ports
New Camera Ports give you better control over how models are viewed in the 3D viewport and how they appear when published.
- The Save Camera Position port allows you to store the current camera view. When a model is published, the saved camera position becomes the default view for anyone opening the model. This ensures that viewers see the model from the intended angle and framing chosen by the creator. This is especially useful when presenting models or product configurations where a specific viewing angle is important.
- The Restore Camera Position port returns the viewport camera to the previously saved position. This allows you to quickly return to a defined camera view while working on a model.
- The Clear Camera Position port removes any saved camera view. Once cleared, the model will no longer have a fixed camera position and will instead open using the default viewer controls.
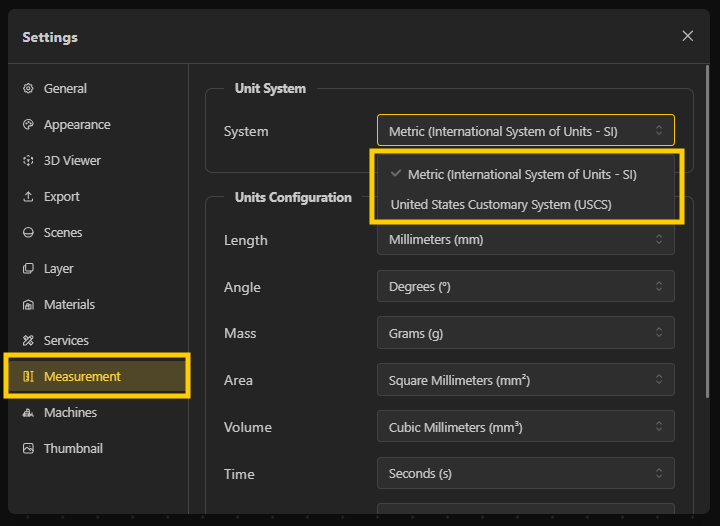
Measurement System Support
BeeGraphy now includes a Measurement System setting, allowing you to configure your preferred system of measurement: Metric or USA (Imperial). You can find it under Main Menu → Settings → Measurement System.
This feature is currently under development, and we’d love to hear your thoughts, your feedback is welcome and appreciated!
New and Improved Nodes
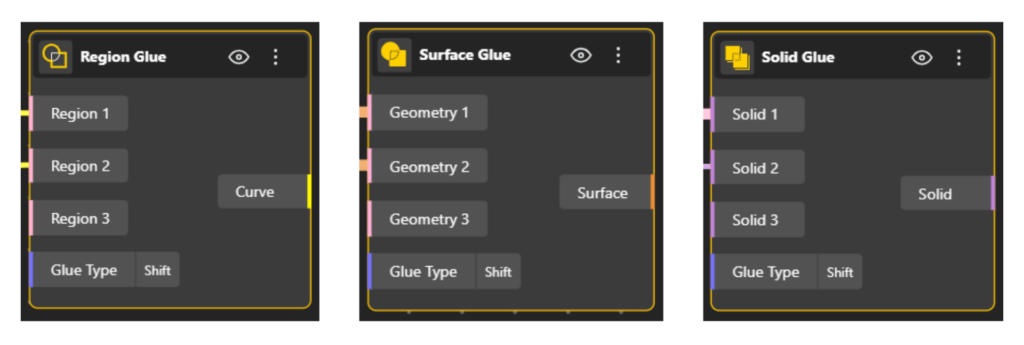
Glue Nodes
A new set of nodes for combining region (curves), surfaces, and solid geometry but with a key difference from the traditional Union boolean operation.
Union rebuilds the entire topology from scratch every time geometry is recomputed, which is slow and computationally heavy. Glue simply attaches solids together while keeping their original structures intact — meaning far less computation, and significantly faster performance, especially in complex or large models.
The new Nodes are:
- Region Glue
- Surface Glue
- Region Glue
This makes Glue particularly valuable in parametric workflows where geometry is constantly being recalculated.
With Glue nodes you can:
- Combine multiple solids quickly without heavy re-computation
- Maintain stable geometry relationships throughout your model
- Keep performance smooth even as complexity grows
Two Modes
- Full: the entire geometry is captured, including overlapping regions
- Shift: only the combined/selected geometry is captured, ignoring overlaps
Range Input Now Supports Units
You can now assign measurement units to Range Input nodes directly in the workspace. Now, instead of raw numbers, your inputs now carry real-world meaning, making models clearer and less error-prone. This feature extends to the configurator as well.
How to Set It:
- Click the scale icon on the node
- Select your unit type
- Select your unit
Default Units
- Length mm
- Angle deg
- Mass gm
- Area sq mm
- Volume cubic mm
- Time s
- Density kg/m³
- Count each
- Temperature Kelvin
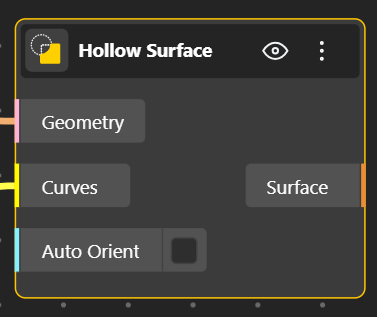
Hollow Surface Node
The Hollow Surface node creates a hollowed-out version of a surface by offsetting it inward by a specified thickness. It subtracts the inner offset from the original, leaving only the wall between the outer and inner boundaries. This is useful for generating lightweight structures, wall panels, or any geometry that needs a defined thickness without a solid interior. For example: door knobs, screw holes, etc.
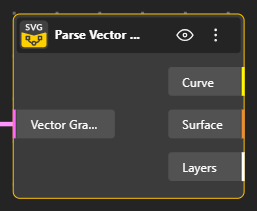
Parse Vector Graphics
The node previously called Vector Graphics has been renamed and improved, and is now called Parse Vector Graphics. The update improves how vector graphics are interpreted and processed, making the node more reliable when working with imported vector data such as SVG-based shapes and paths.
With Parse Vector Graphics, users can:
- Convert vector graphics into usable curve geometry
- Work with imported vector designs inside parametric models
- Use vector paths as inputs for further modeling operations
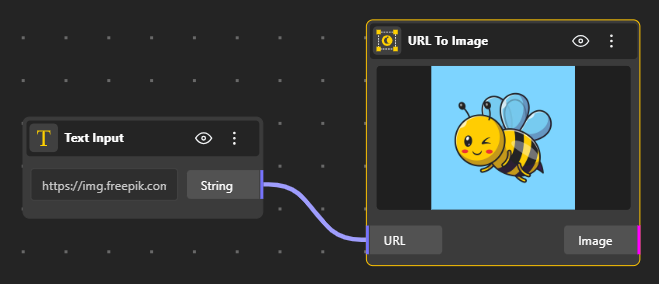
URL to Image
A new URL to Image node allows you to load images directly from a web link. This makes it easier to integrate external images into BeeGraphy workflows without needing to manually upload files. Paste a URL in Text Input, connect it to the URL to Image Node → Image loads straight into your BeeGraphy workflow.
Supported Formats: PNG JPEG JPG SVG GIF TIFF and more.
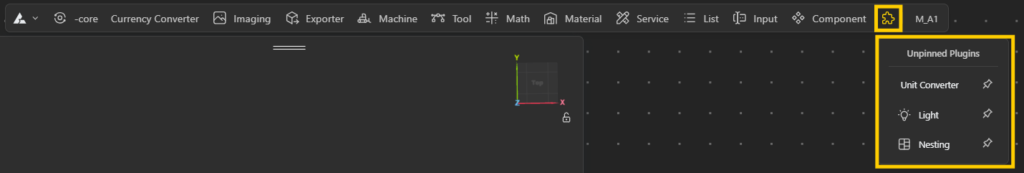
Customizable Toolbar
The BeeGraphy toolbar can now be customized to match your workflow. You can organize your workspace by pinning or unpinning tool packages, allowing you to keep frequently used tools easily accessible while reducing clutter in your interface.