Table of Contents
We have some exciting news to share with BeeGraphy’s community as well as parametric modeling and computational design enthusiasts! On April 1st, we released a major update to our Editor, which will make your workflow more efficient. Our team of software engineers has been working tirelessly to incorporate all of the feedback we’ve received from our early users, and we’re excited to share them with you today.
Although it’s still in beta and has bugs, we’ve made significant improvements to both the design and functionality of the BeeGraphy Editor – the first online parametric modeling software with collaboration features.
BeeGraphy’s 2023 April batch of updates includes a major UI redesign, light and dark modes, lists of lists, data matching algorithms, text nodes, paneling nodes, new curve analysis nodes, and a panel for easier debugging. Let’s dive into each of these features and explore how they can improve your workflow.
User Interface
We gave our Editor a major facelift! The old version was pretty decent, but let’s face it, it was far from perfect. Our new design is not only prettier but also more user-friendly for those of you who like to work on your tablets. Right now, the back end isn’t set up for tablet compatibility just yet, but don’t worry, we’re already working on it.
For those who haven’t seen our old version, check out this screenshot.
")
BeeGraphy Editor’s old interface
And here is a screenshot of the same script in the new version.
")
BeeGraphy Editor’s new user interface
Dark Mode
We also added a feature that many users have been asking for – the dark mode! The BeeGraphy workspace and Editor will automatically match your system setup, so if you have your system set up for dark mode, then the Editor will open in dark mode as well. There’s no toggle to manually switch between light and dark modes, but if you need one, let us know. Meanwhile, it will be all automatic.
")
BeeGraphy Editor interface in dark mode
Lists of lists
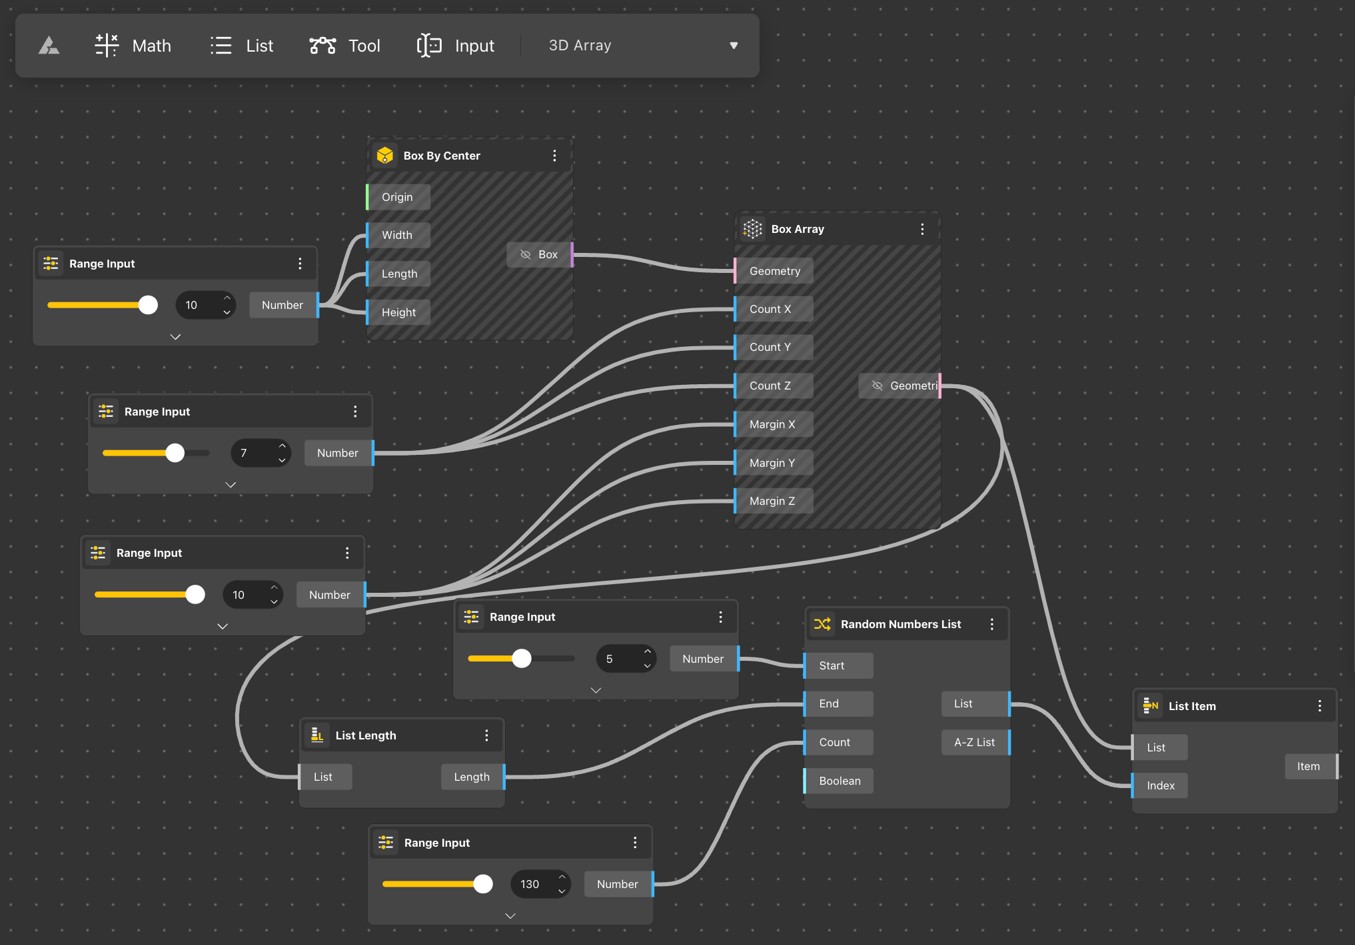
Previously, our Editor’s lists were limited to being flat, but now, with the new update, we’ve added the ability to use nested lists. This feature offers more flexibility in obtaining the data you need. Check out the gif below, where you can see an array of rectangles. With the help of the list of lists feature, we can extract the components of each element found in the array. This opens up a whole new range of possibilities in data manipulation and analysis.

Lists of Lists in BeeGraphy Editor
Data Display
We’ve made it easier to access the data in the node in two ways. Firstly, you can now simply click on the input or output of a node to see its data displayed below it.
However, the display disappears after any click. So, if you want the display to be fixed, you can use the new Panel node. Just connect the panel to any node output and voila! The data will appear inside the panel, making it easy to see and work with.

Data display in BeeGraphy
Data matching algorithms
We’ve made data matching from lists of different sizes easier with by enabling to select the data matching algorithm. When you right-click on a node, you can select from three different options for the output: Shortest List, Longest List, or Cross Reference.

Data matching algorithms in BeeGraphy
Shortest List means that when two lists of different lengths are matched, the data from the longer list will be matched one on one until the shortest list finishes.

Shortest list in BeeGraphy Parametric
Longest List, on the other hand, will connect the data from the longer list one on one until the shorter list finishes, and the remaining data from the longer list will be connected to the last data from the shorter list.

Longest list in BeeGraphy
Finally, if you choose Cross Reference, each data from each list will be matched with all the data from the other list, regardless of the list lengths.

Cross reference in BeeGraphy Editor
Text nodes
Text nodes are used to add and manipulate text data within a parametric design workflow. Text nodes can be used to create labels, annotations, and other text-based information that can be displayed as part of the design output.
Some common uses of text nodes include:
- Labeling geometry: Text nodes can be used to add labels and annotations to geometry, making it easier to identify and differentiate different elements in the design.
- Creating custom descriptions: Text nodes can be used to add custom descriptions and comments to the design, making it easier to understand and communicate design intent.
- Displaying data: Text nodes can be used to display data such as numerical values, parameters, or other information related to the design.
- Creating user interfaces: Text nodes can be used to create user interfaces for the design, allowing users to input and manipulate text-based data in real time.
Paneling
Paneling in parametric design refers to creating a repetitive pattern of segments or cells, known as panels, on a surface or solid. These panels can be of any shape or size. Paneling is commonly used in parametric design to create complex, organic-looking surfaces and facades for buildings, furniture, and other products.
Our updated version enables to split surfaces into panels of triangular, quadrangular, diamond, and hexagonal shapes.
Quadrangular panel

Quadrangular panel in BeeGraphy
Hexagonal panel

Hexagonal panel in BeeGraphy
Diamond panel
Curve analysis
Curve analysis components enable computational designers to analyze and manipulate curves and curves-based geometry within a parametric design workflow. These components allow users to perform various operations on curves, including measurement, manipulation, and optimization.
Some common tasks that can be accomplished with curve analysis components include:
- Measuring curves: Curve analysis components can be used to measure the length, curvature, and other properties of curves in the design, making it easier to understand and manipulate the geometry.
- Adjusting curves: Curve analysis components can be used to adjust the shape and position of curves in the design, allowing users to create custom curves that meet specific design requirements.
- Optimizing curves: Curve analysis components can be used to optimize curves and curves-based geometry for specific design criteria, such as smoothness, curvature continuity, or surface area.
- Creating custom geometries: Curve analysis components can be used to create custom geometries based on curves, such as surfaces, solids, or other complex shapes.
Below are examples to show how the Curve Proximity node works, and how Evaluate Curve works.
Curve Proximity enables one to find the two nearest points of two curves

Curve Proximity in BeeGraphy
Evaluate Curve enables locating a dot on the curve based on its distance from the beginning of the curve. The distance can be specified either in absolute values, like millimeters or as a ratio, like 0.1 for 1/10th of the curve length.

Curve Proximity feature in BeeGraphy
More information on these features can be found in the Editor’s Documentation.
We’re always looking for ways to improve the online parametric modeling software, and we need your feedback to do that. We encourage you to open the Editor, try it out, and let us know what you think. If you encounter any bugs or have any suggestions for how we can improve the Editor, please don’t hesitate to contact us via Ask BeeGraphy page, e-mail support@beegraphy.com, or our Discord channel. We look forward to hearing from you!