Table of Contents
If you’re new to computational design, the concept of data trees might sound a bit complex, but they are fundamental to organizing and managing data efficiently in computational design platforms. This guide will break down what data trees are, explain their components, and show you how they can be used effectively in your design workflow. By the end, you’ll have a solid understanding of how to use data trees to achieve efficiency, solve problems, and follow best practices in your designs.
What Are Data Trees?
A data tree is a structured way of organizing data in computational design. Think of a data tree like a family tree. Just as a family tree organizes people into generations and branches, a data tree organizes information into a hierarchical structure. In computational design, this structure helps you manage complex data, like a list of points, curves, or other design elements.
Why Are Data Trees Important?
In computational design, you often work with a lot of data. For example, if you’re designing a building, you might have hundreds of points that define its shape, or multiple surfaces that need different materials. Managing all this data can be overwhelming if it’s all in one big list.
Data trees help by organizing this information into smaller, more manageable chunks. This organization makes it easier to apply changes to certain parts of your design without affecting everything else. For instance, you could easily change the shape of just one part of a structure or apply a specific material to only certain surfaces.
Constituents of Data Trees
To understand data trees in computational design, it’s essential to break down their key components: items, lists, branches, and paths. Let’s explore each of these with a simple, relatable example.
1. Items
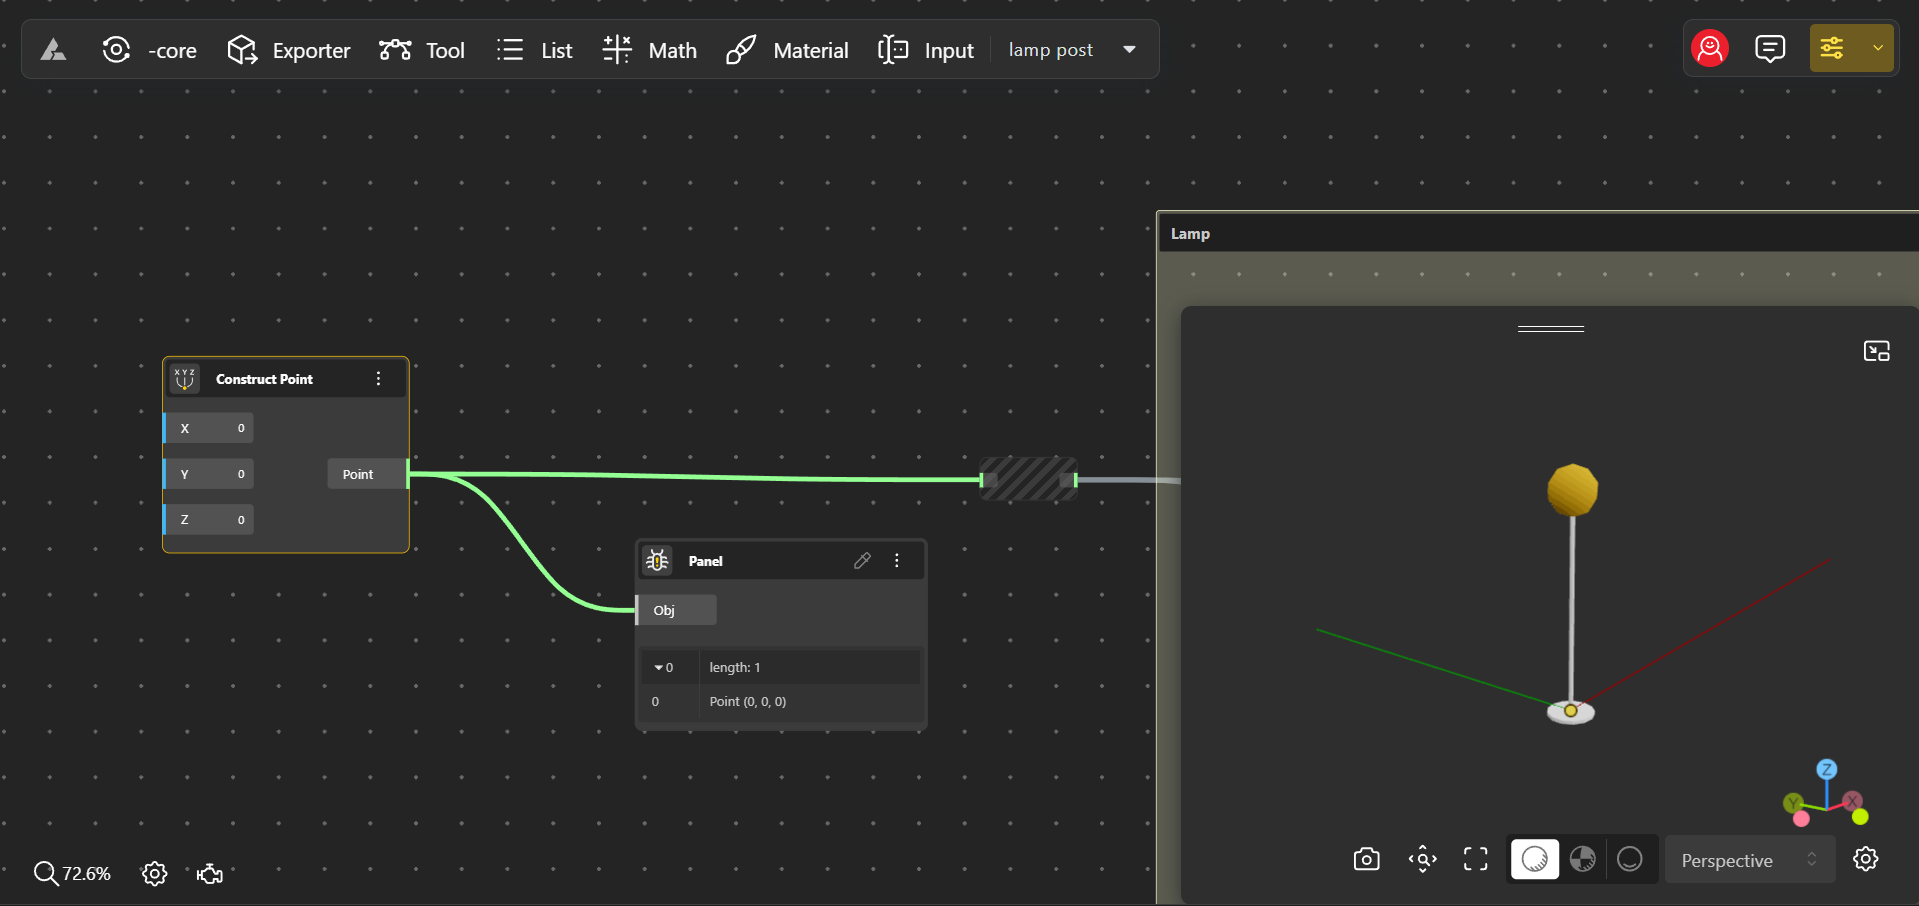
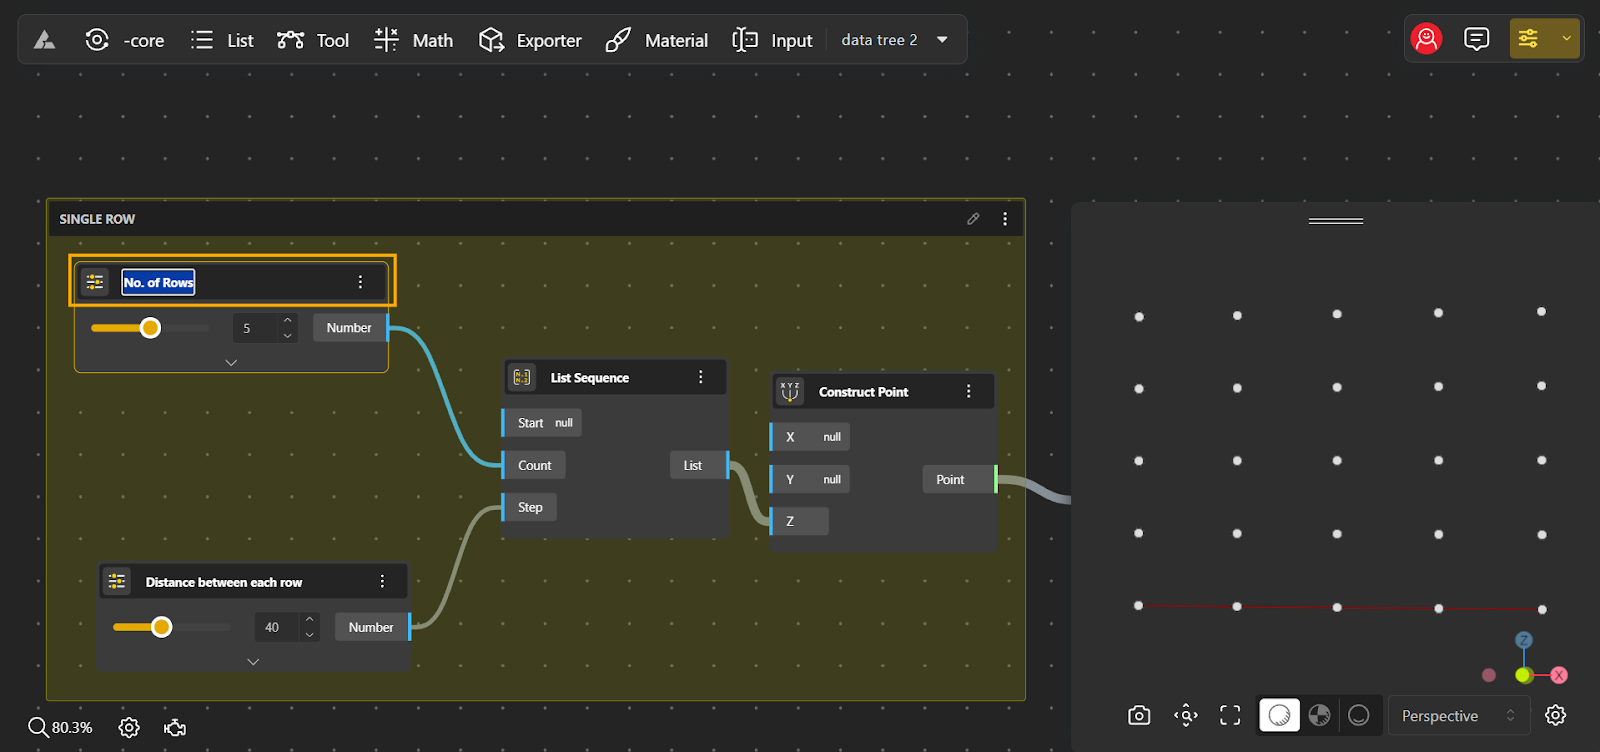
An item is the most basic piece of data in a data tree. Imagine you’re designing a parametric grid of lamp posts for a public park. Each lamp post’s position on the grid can be described by its coordinates—let’s say (X, Y, Z). In this scenario, each set of coordinates (like 0,0,0) represents a single item. These are the smallest units of data in your design, like individual points in a 3D space.
2. Lists
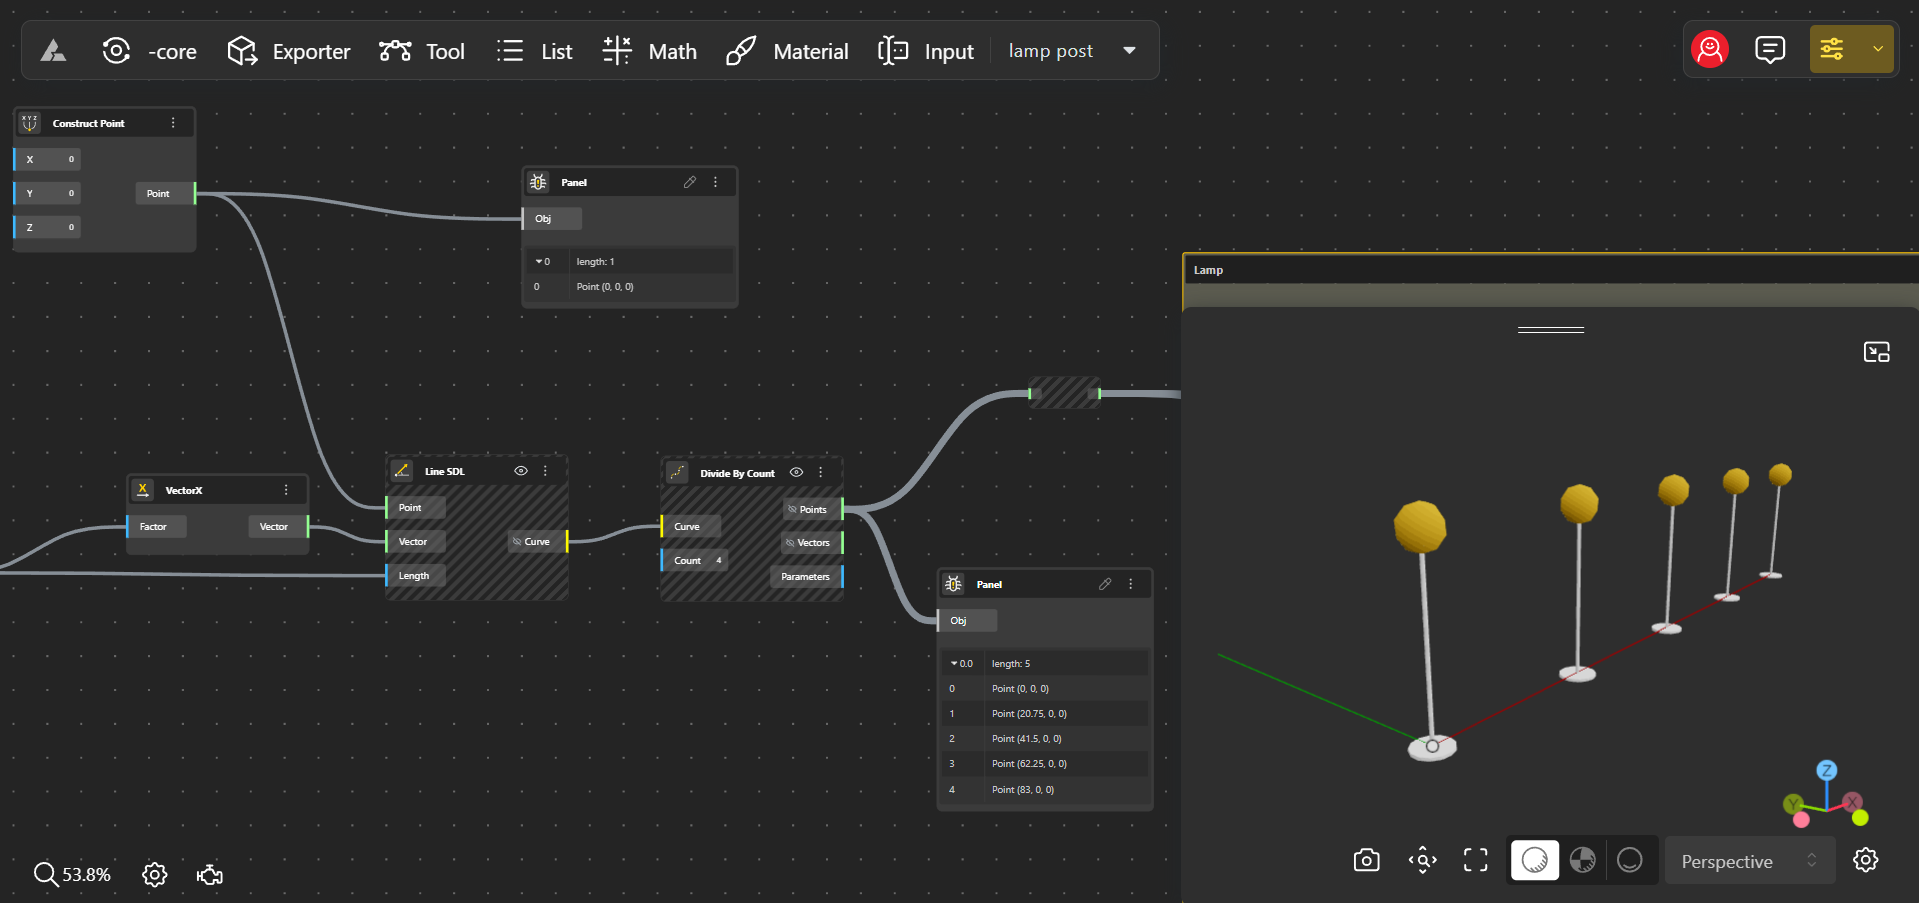
In computational design, a list refers to an ordered collection of items. Continuing with our park example, you might want to group all the lamp posts that are in a single row. So, a list would contain all the coordinates (items) of lamp posts along one row. For instance, if you have a row with 5 lamp posts, the list would include all 5 coordinate sets, making it easy to manage or manipulate that entire row at once.
A list is an ordered collection of items, such as geometric objects or data, that can be manipulated, iterated, and transformed in parametric and algorithmic workflows. In summary, an item is an element within a list, and a list is a collection of multiple items.
3. Branches
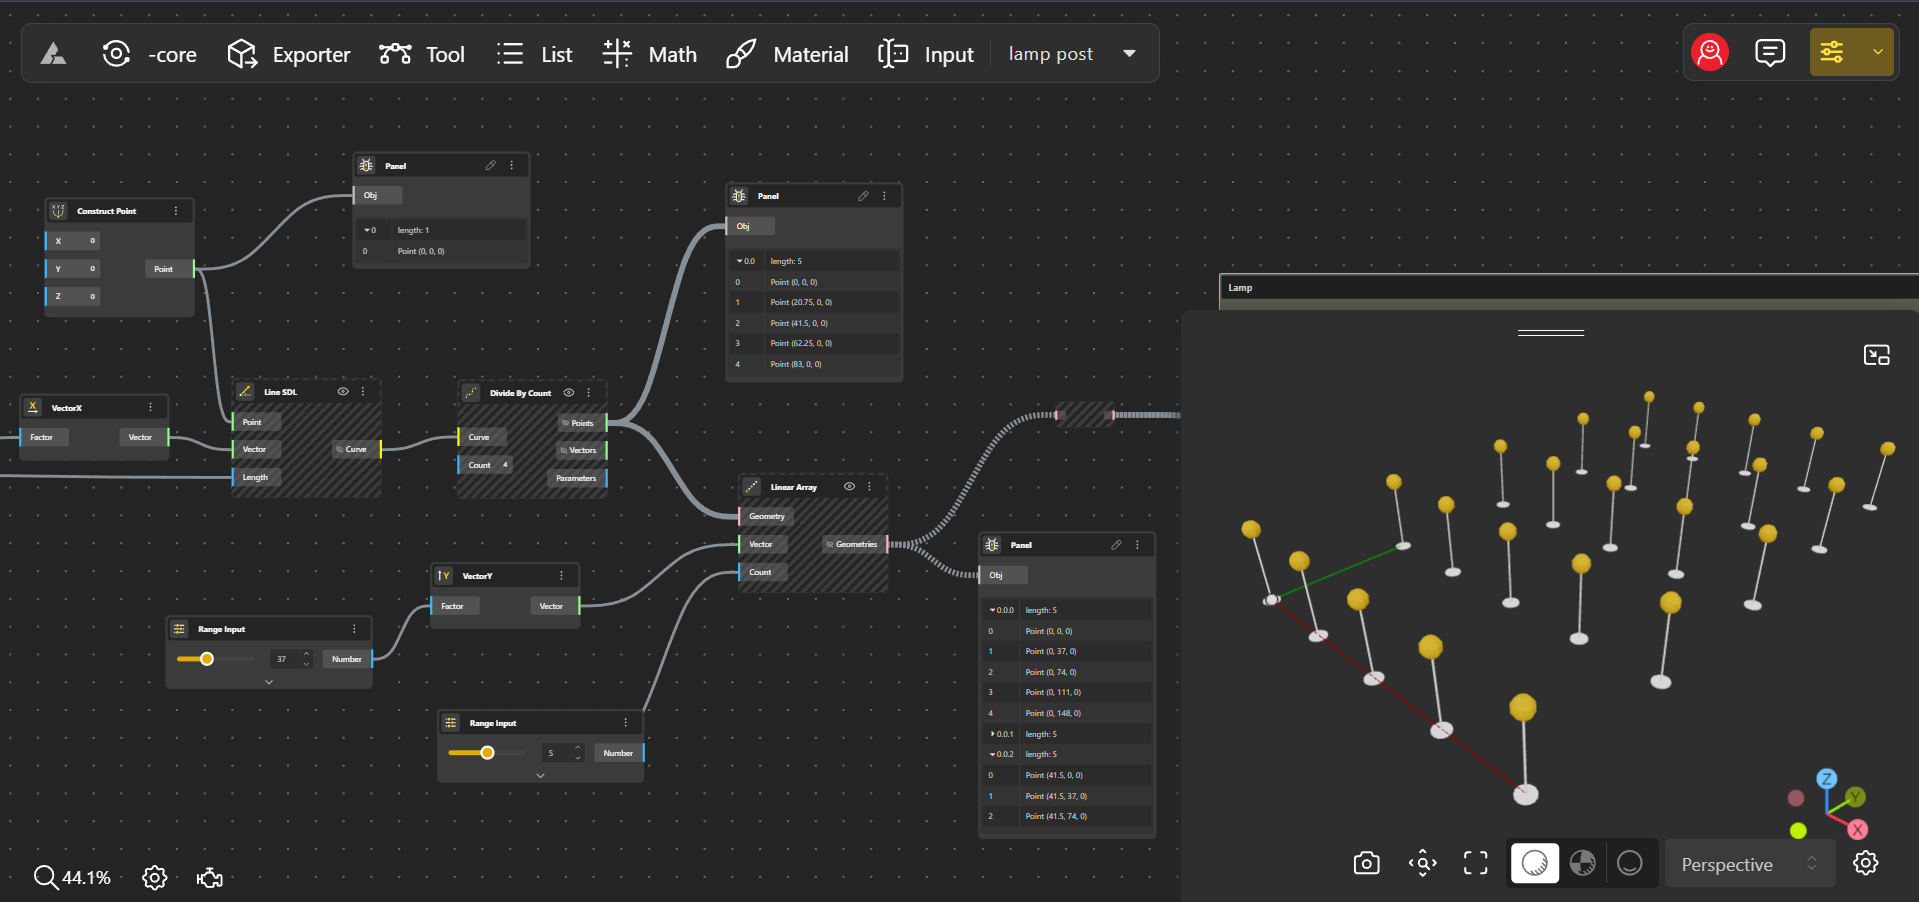
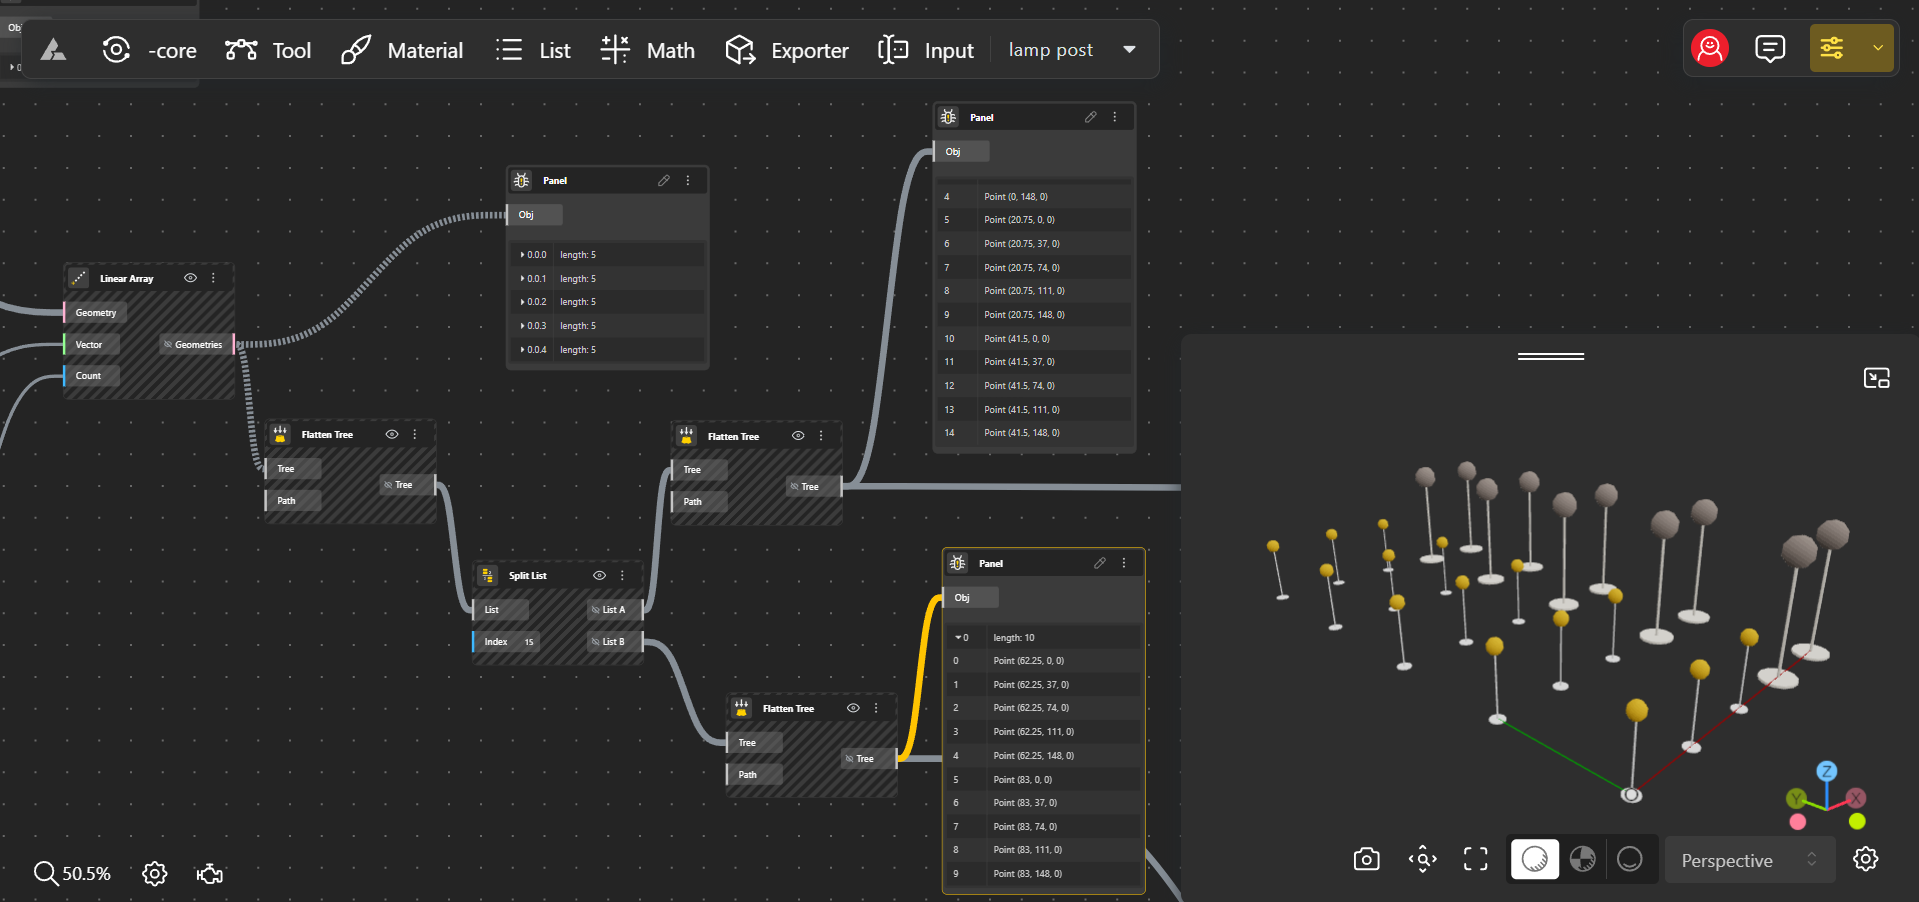
A branch is a larger grouping that holds one or more lists. In our park design, you might have several rows of lamp posts, each represented by a list of coordinates. Each row of lamp posts can be considered a branch. So, a branch could contain lists for all the lamp posts in different rows. For example, Branch 1 could contain a list or items for the first three rows, Branch 2 for the next three rows, and so on. Branches help you organize your data into different levels, making it easier to apply changes to specific parts of your design without affecting others.
4. Paths
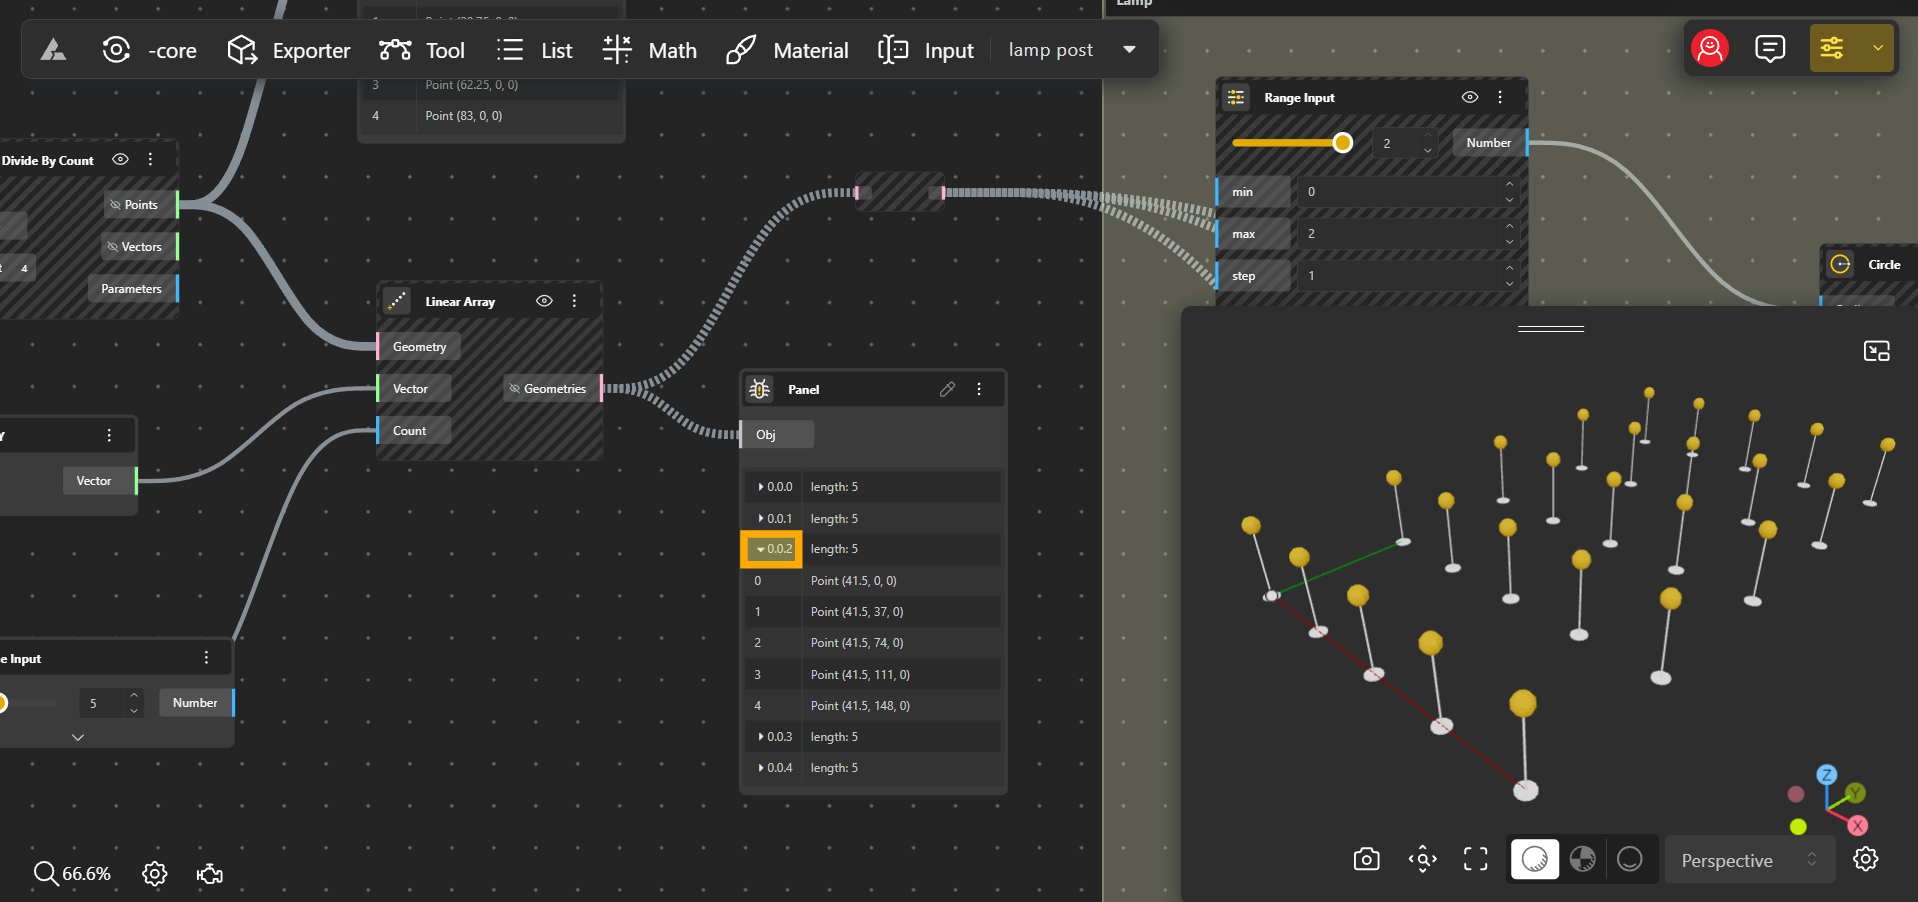
A path is a unique identifier that tells you where a particular list or item is located within the data tree. It’s like an address in a postal system, guiding you to the exact location of data. Typically, the path is represented as a series of numbers (like 0.0.2) that signify different levels of the data structure, with each number corresponding to a specific level.
Think of a path as a “roadmap”, that guides you to a precise location. In our park example, if you want to find the coordinates of a lamp post in the second row of the third branch, the path will tell you exactly where to look. Paths help you navigate the data tree efficiently, especially when dealing with complex designs.
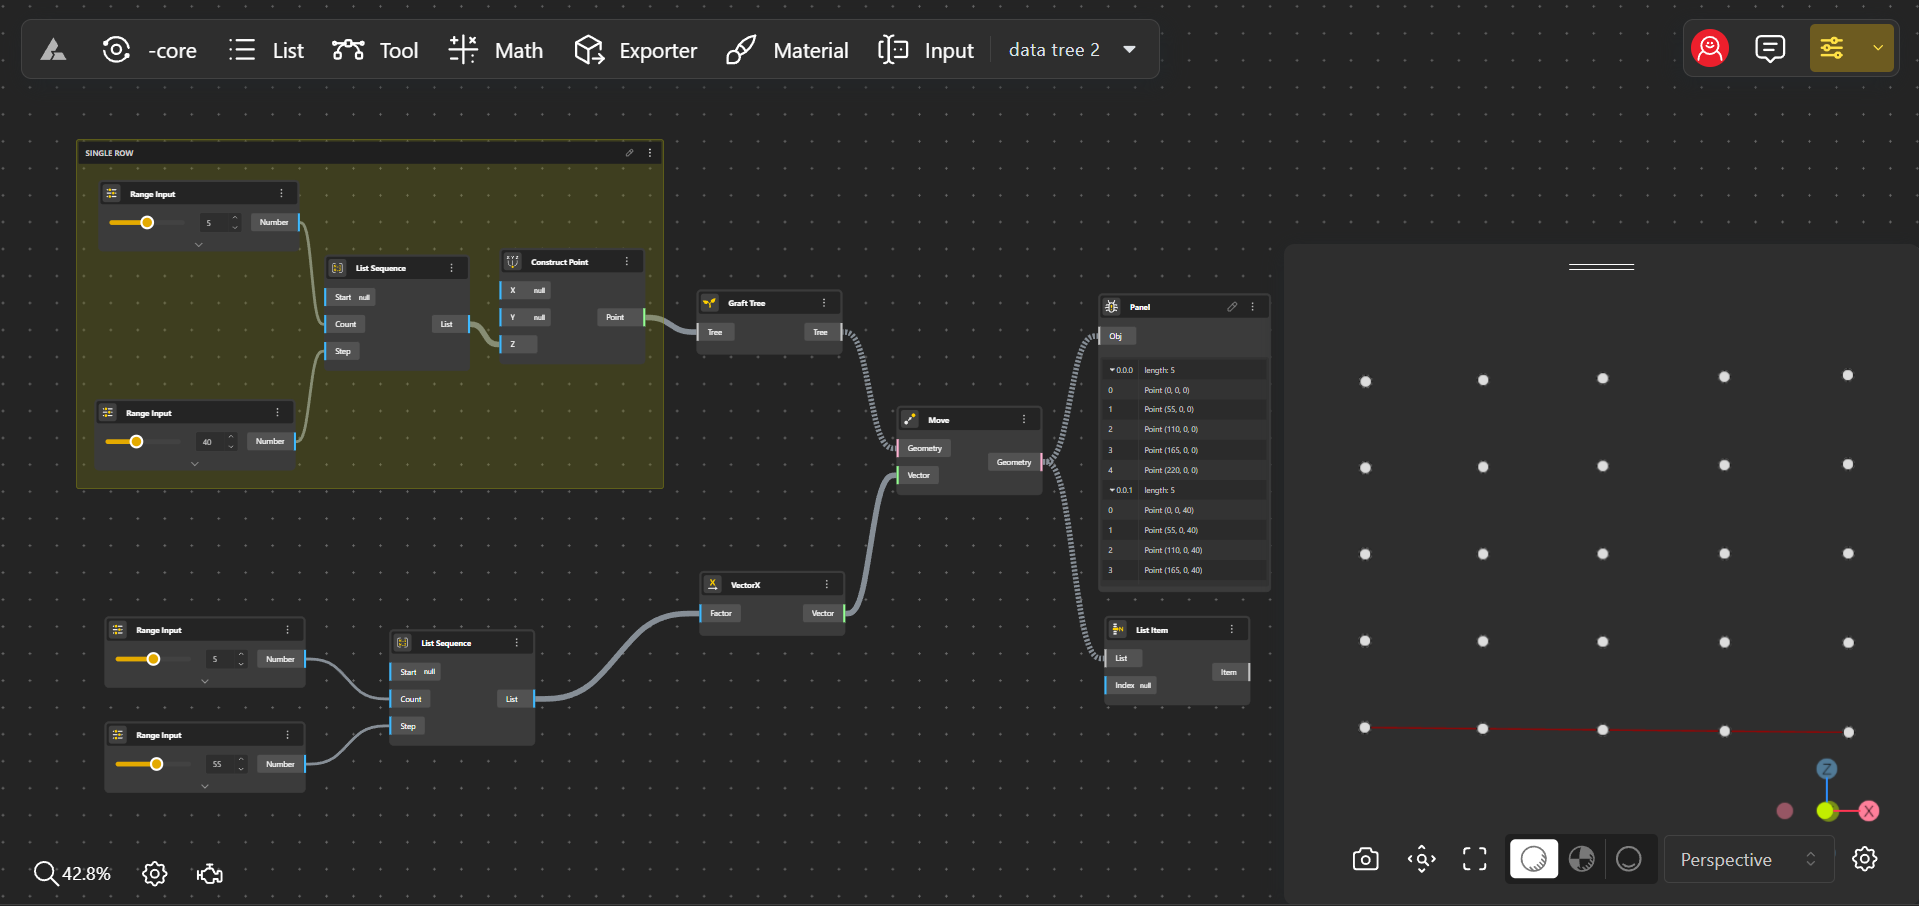
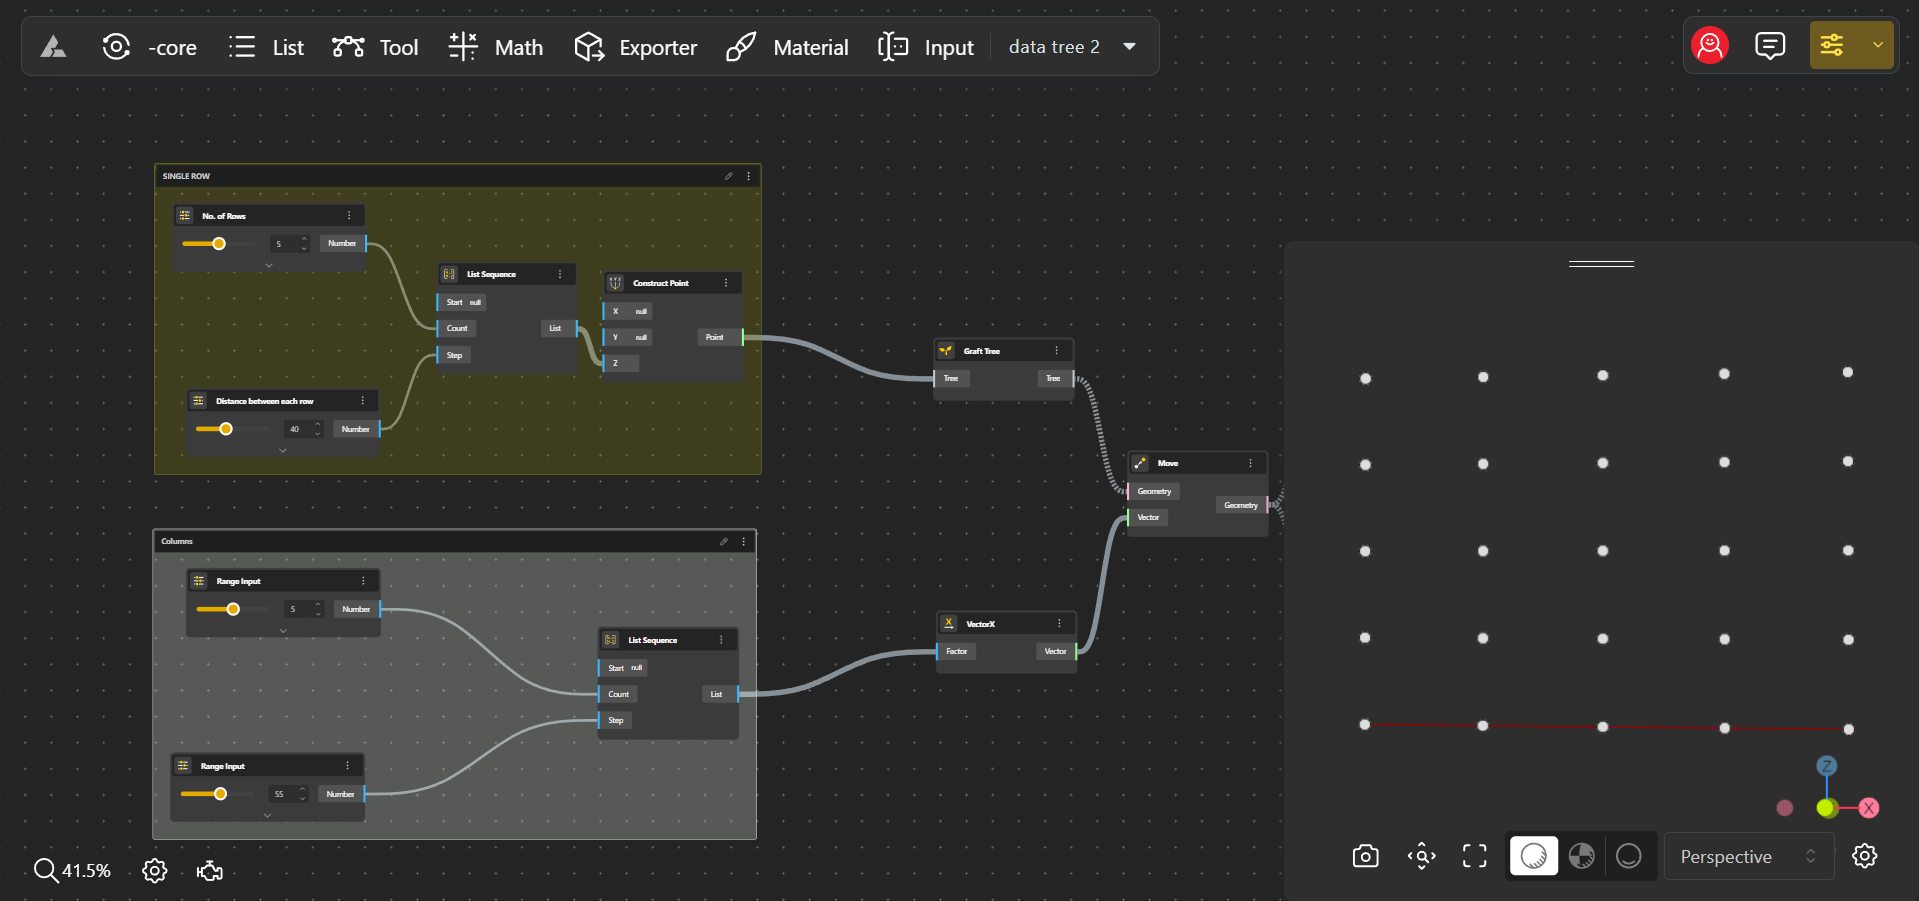
Putting It All Together: Designing a Park Lighting Grid
- Items: The smallest units of data, such as the coordinates (0, 50, 75) of a single lamp post in a park grid. Each item represents an individual data point.
- Lists: Collections of items, typically representing a group of related data points, like the positions of all lamp posts in a single row. Lists help organize and manipulate groups of data together.
- Branches: A branch is a higher-level container that holds a list or item. Each branch corresponds to a specific row or section of data, helping to categorize and structure data more efficiently.
- Paths: Unique identifiers that provide the address of specific items or lists within the data tree. Paths act like a roadmap, guiding users through different levels of the structure to locate exact data points.
Using this structure, you can easily control the placement, spacing, or even the height of the lamp posts in specific rows or groups without affecting the entire park layout. Data trees, with their organized structure of items, lists, branches, and paths, allow you to manage and manipulate complex designs efficiently, making them an essential tool in computational design.
Data Tree Operations
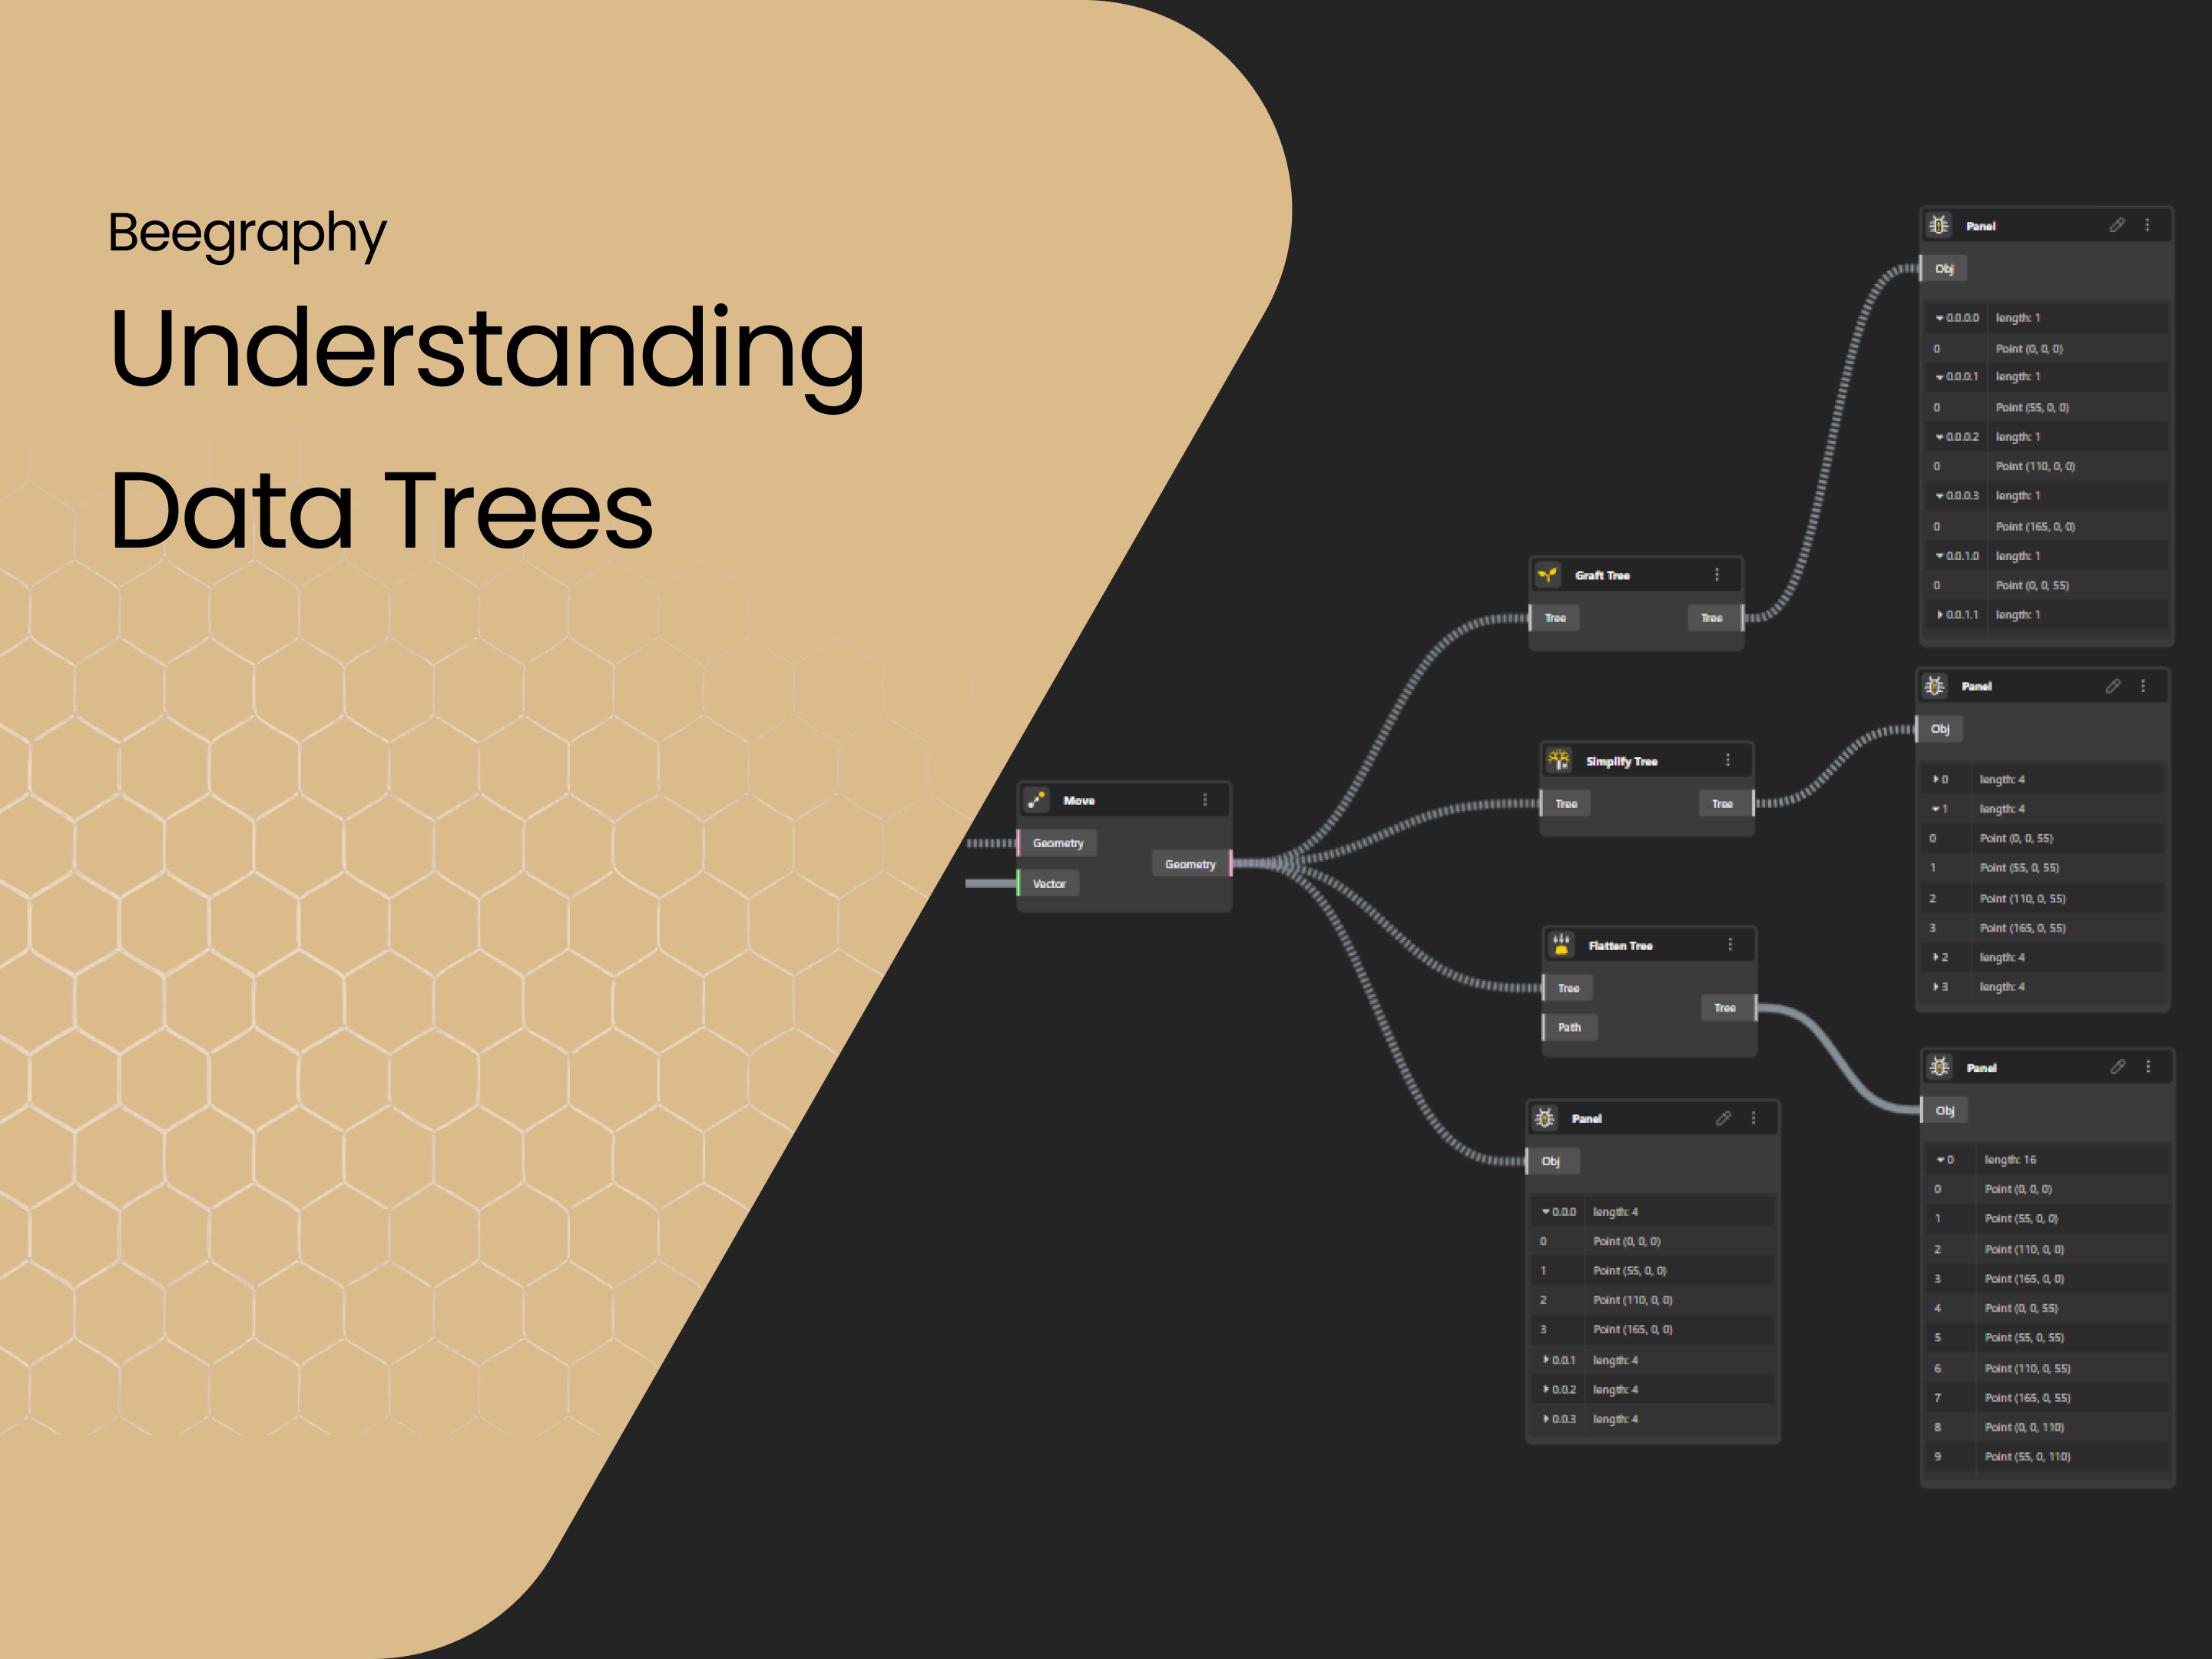
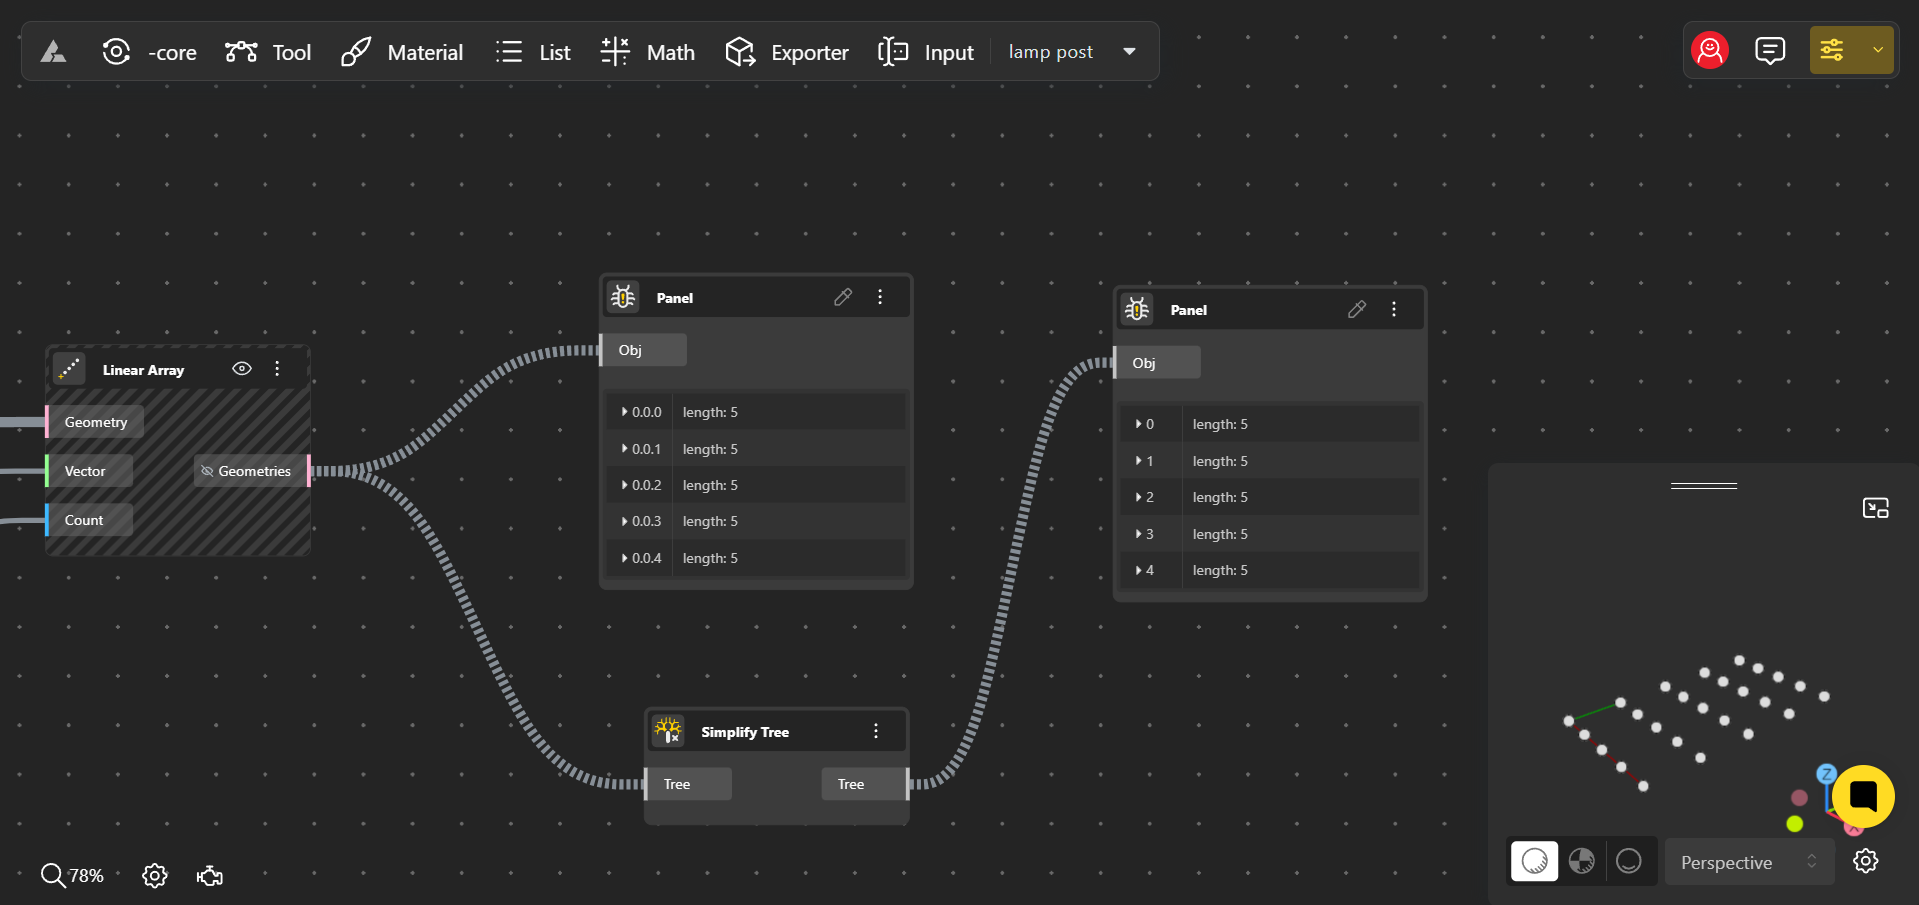
When working with data trees in Beegraphy, managing and organizing data efficiently is key to creating complex and adaptable designs. To do this, you can apply various operations to modify the structure of your data trees. Three of the most common and powerful operations are simplify, flatten, and graft. Understanding these operations and how they affect your data trees can help you maintain a clean, organized, and efficient design process.
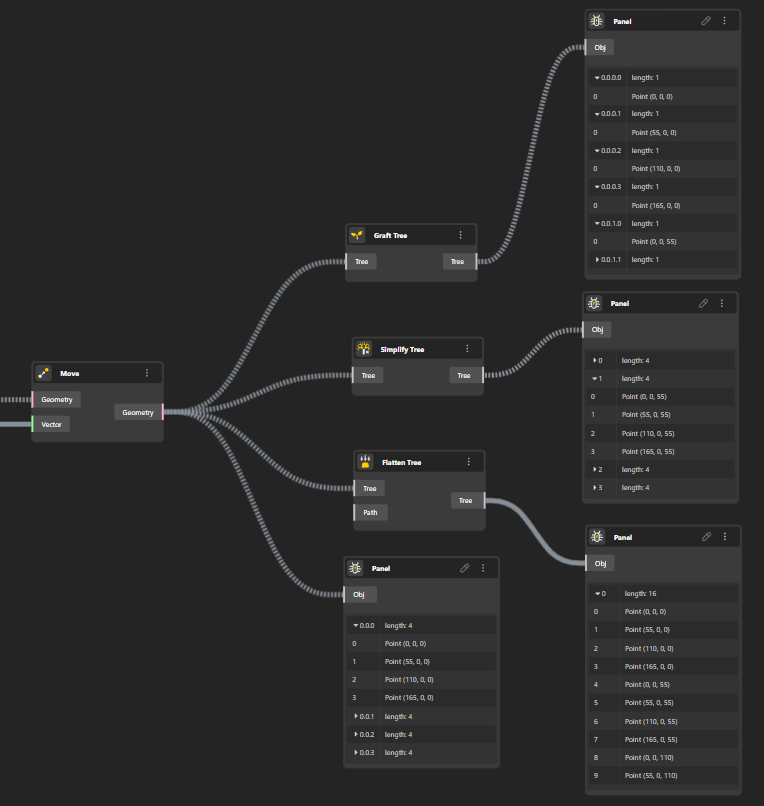
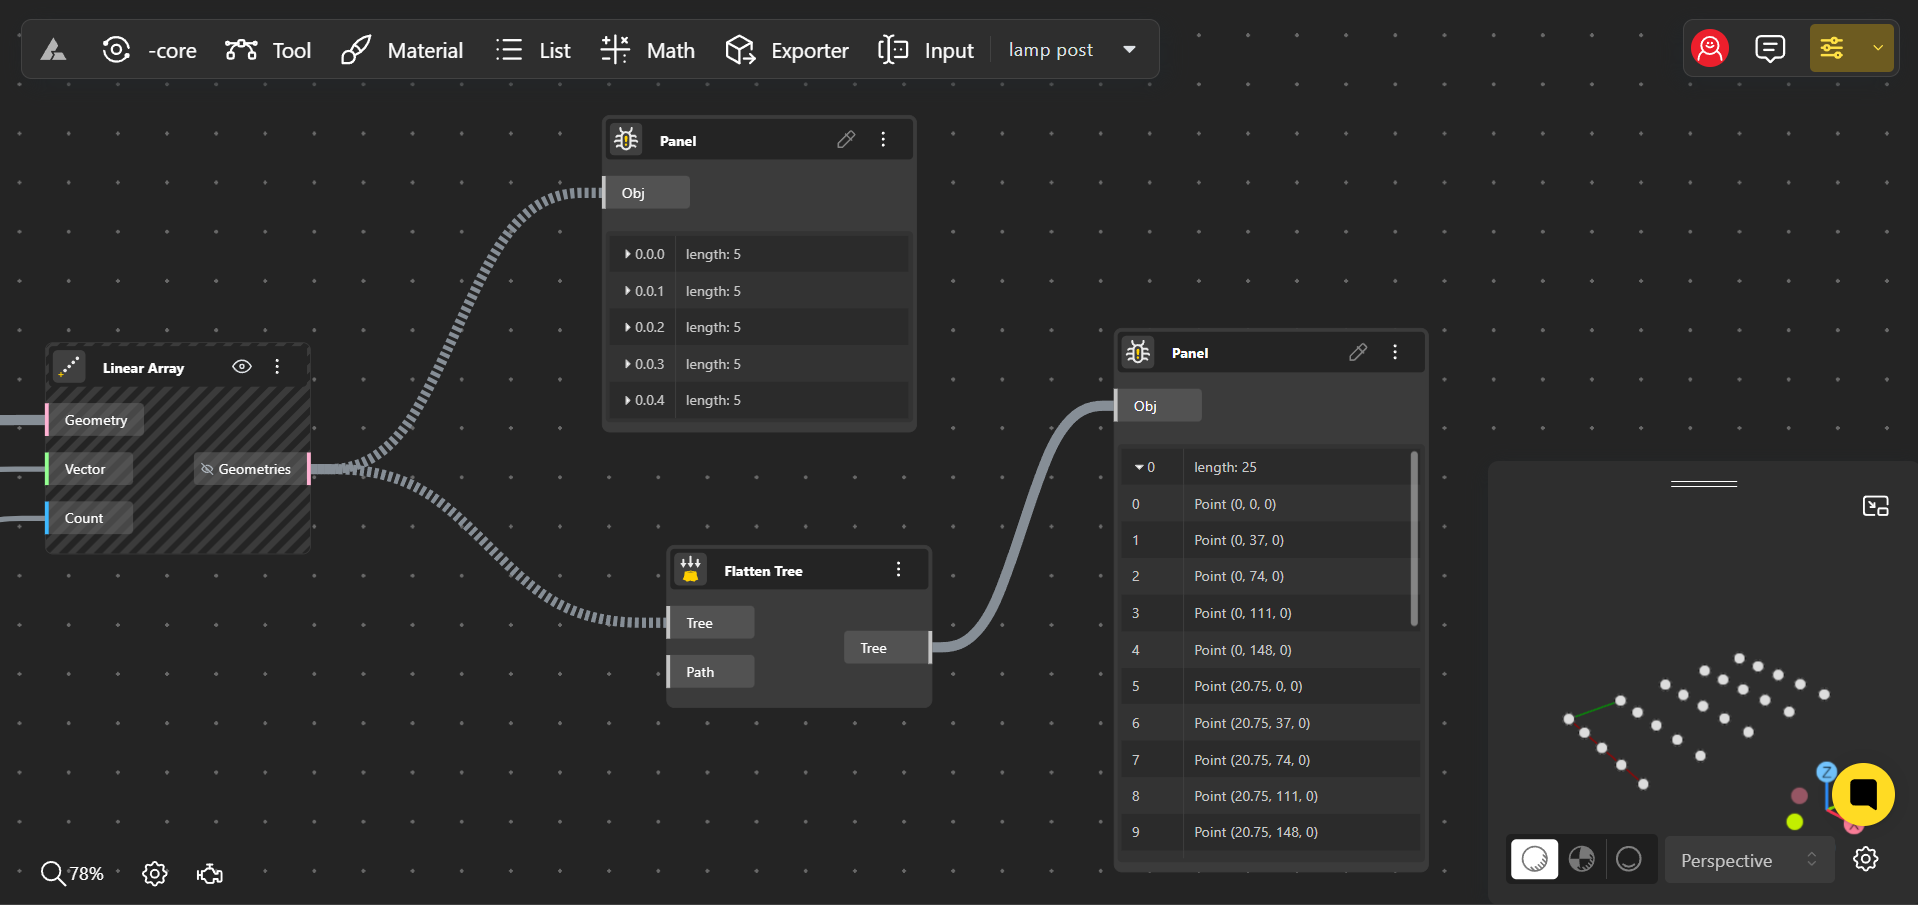
1. Simplify: Cleaning Up the Data Tree
Simplifying a data tree means refining its structure by reducing unnecessary path details. It’s like decluttering your workspace—removing extra layers of information that don’t affect the final design.
Simplify Operation
How Simplify Works:
- Example: Imagine a data tree where each branch represents groups of objects, and some branches have extra path levels that don’t impact the objects themselves. Simplifying removes these irrelevant path levels, making the structure clearer without affecting the actual branches or their data. In this case, you can notice the path has been simplified from 0.0.1, 0.0.2, 0.0.3… to 1,2,3…, removing unnecessary hierarchy.
- Result: The paths in your data tree become shorter and more direct, making it easier to manage and navigate. This is especially helpful when your tree has complex paths that don’t add meaningful distinction between data points.
- Use Case: Simplifying is useful when finalizing a design and needing a cleaner, more efficient data structure. For instance, if you’ve been working with multiple parameter layers and are now focused on the final output, simplifying reduces the complexity of the paths while preserving the necessary data branches.
2. Flatten: Merging All Data into a Single List
Flattening is another essential operation, especially when you need to consolidate data. When you flatten a data tree, all the data across different branches is merged into a single, unified branch. This is akin to taking all the files from various folders on your computer and placing them into one single folder.
Flatten Operation
How Flatten Works:
- Example: Suppose you have a data tree where each branch contains a list of points defining different shapes. Flattening this tree would combine all these points into a single list, regardless of which shape or branch they originally belonged to.
- Result: After flattening, all data is organized into one list, with no distinction between the original branches. This operation is particularly useful when you want to apply the same operation to every item in the tree, regardless of its original grouping.
- Use Case: Flattening is ideal when you need to perform global operations across all data points, such as applying a uniform transformation (like scaling or rotation) to every item in your design. It simplifies the structure but removes the hierarchical context of the data, so it’s best used when branch-specific organization is no longer necessary.
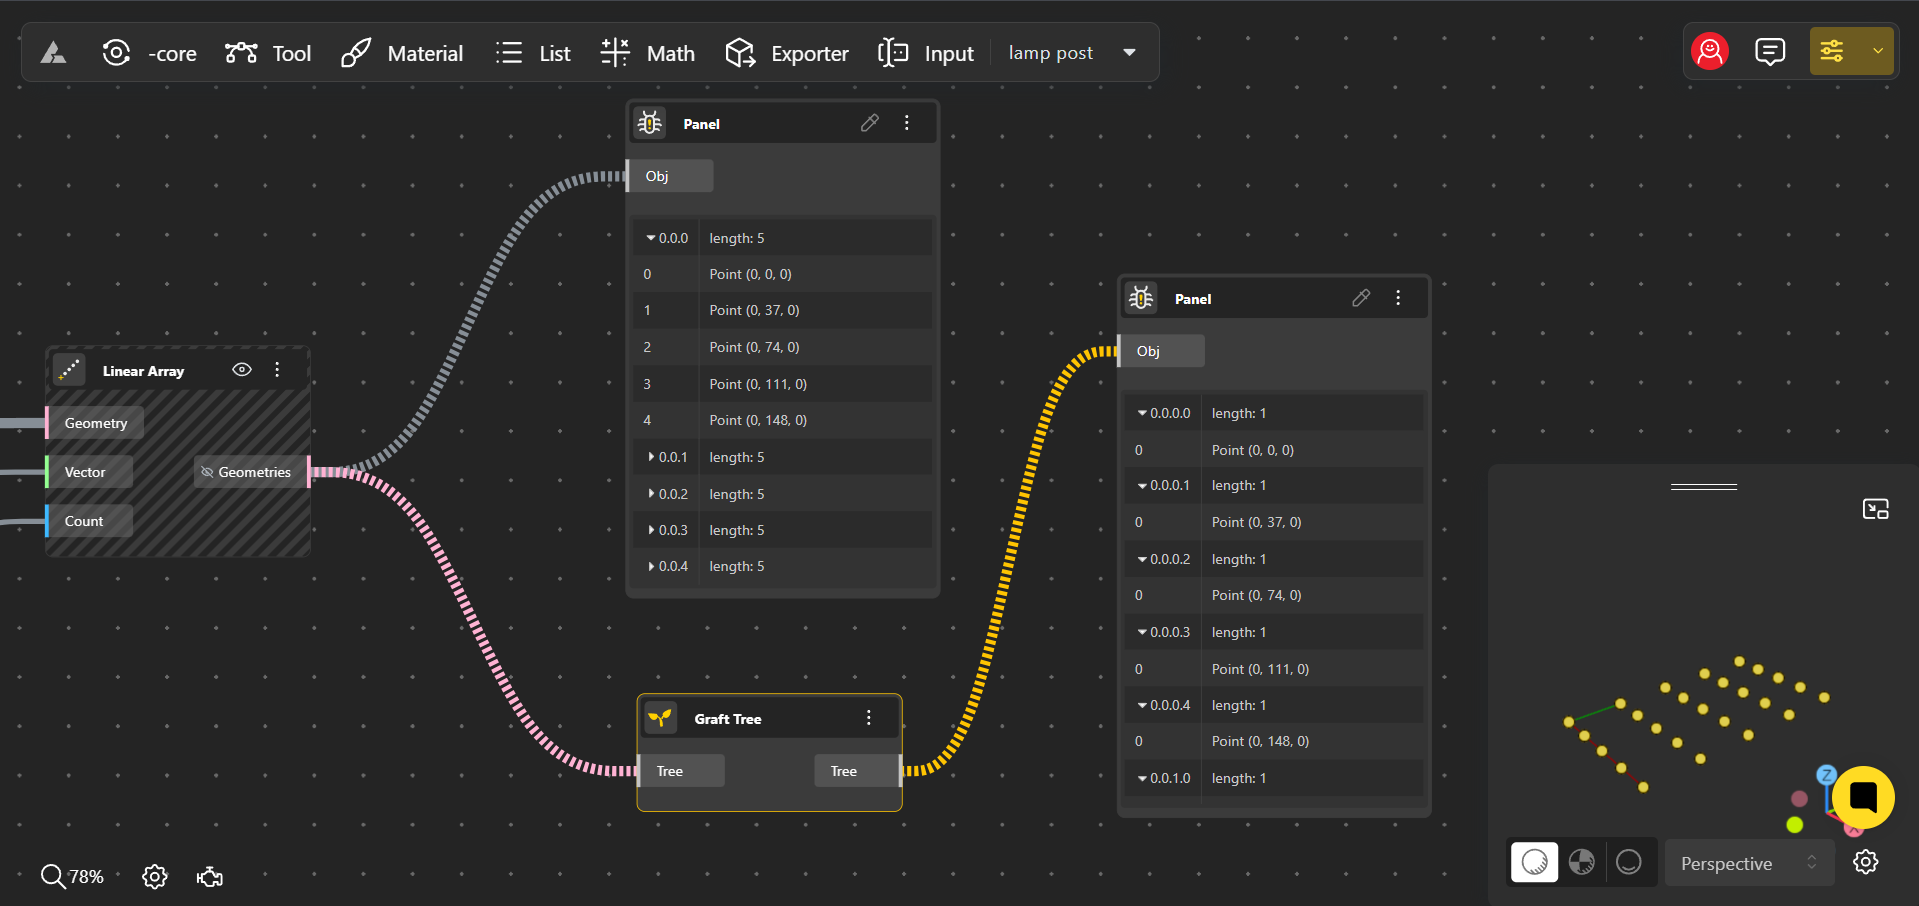
3. Graft: Expanding the Tree Structure
Grafting is the most complex of these operations, and it’s used when you want to increase the granularity of your data tree by adding more levels of hierarchy. When you graft a tree, each existing branch is split into smaller branches, with each item in the original branch getting its own new branch.
Graft Operation
How Grafting Works:
- Example: Imagine you have a data tree where each branch represents a row of points in a grid. By grafting, you separate each point in a row into its own branch, effectively turning each point into a branch on its own.
- Result: The tree becomes much more detailed, with each item now located on its own distinct path. This operation is crucial when you need to apply different operations to each individual item or when preparing data for a component that requires inputs to be in separate branches.
- Use Case: Grafting is particularly useful in scenarios where each item needs individual attention. For instance, if you’re designing a complex façade where each panel needs to be treated differently (e.g., with unique textures or dimensions), grafting allows you to isolate each panel and apply operations to them independently.
Choosing the Right Operation for Your Workflow
Understanding when and how to use these operations can greatly enhance your efficiency in Beegraphy:
- Simplify when you need to streamline your data tree by removing unnecessary levels, making it easier to navigate and manage.
- Flatten when you want to treat all items equally, merging them into a single list for global operations.
- Graft when you need to increase the specificity of your data tree, allowing for individual item manipulation.
Achieving Efficiency with Data Trees
Efficiency in computational design is about more than just speed—it’s about reducing complexity and enhancing control. Data trees provide a framework for this by allowing you to compartmentalize and manage data more effectively. Here are some ways to achieve efficiency with data trees in Beegraphy:
- Selective Processing: By structuring your data into branches, you can apply operations to specific parts of your data without affecting the entire dataset. This selective processing reduces computational load and increases responsiveness.
- Parallel Operations: Data trees enable parallel processing by allowing you to run operations on multiple branches simultaneously. This parallelism is particularly useful in large-scale projects where time is a critical factor.
- Simplified Debugging: When working with complex algorithms, errors are inevitable. Data trees make debugging easier by isolating different parts of your data. If an error occurs, you can quickly trace it back to a specific branch, simplifying the debugging process.
- Reusable Structures: Once you’ve set up a data tree structure for a particular type of problem, it can often be reused in different contexts with minimal adjustments. This reusability saves time and ensures consistency across projects.
Problem Solving with Data Trees
Data trees are not just about efficiency—they are powerful tools for problem-solving. Here’s how they can help you tackle complex design challenges:
- Hierarchical Data Representation: Many design problems are inherently hierarchical. For instance, an architectural project might involve different levels of detail—from the overall site layout down to individual room furnishings. Data trees naturally align with these hierarchies, allowing you to manage each level independently while maintaining a coherent overall structure.
- Conditional Logic: By organizing your data into branches, you can apply conditional logic to different parts of your data. For example, you might want to apply different materials to different types of surfaces within a building. Data trees make it easy to implement such logic, as each branch can be treated independently.
- Iterative Design: Design is often an iterative process, with multiple revisions and refinements. Data trees facilitate this by allowing you to iterate on specific branches without disrupting the entire design. This approach speeds up the iteration process and makes it easier to test different design alternatives.
Best Practices for Using Data Trees in Beegraphy
To maximize the benefits of data trees in Beegraphy, consider the following best practices:
- Plan Your Data Structure: Before diving into your design, take some time to plan out your data tree structure. Consider how your data will be organized and how different branches will interact. A well-thought-out structure will save you time and headaches down the line.

Planning the data structure
- Keep It Modular: Break down your design process into smaller, modular components. Each component can then be associated with a specific branch or set of branches in your data tree. This modularity makes your design more flexible and easier to manage.
Modular Structure
- Use Clear Naming Conventions: Naming your branches clearly and consistently helps keep your data tree organized. It also makes it easier for others (and your future self) to understand and work with your design.
Naming the inputs
- Leverage Beegraphy’s Tools: Beegraphy offers a range of tools for working with data trees, including visualizations and debugging aids. Make use of these tools to better understand the structure of your data and identify any potential issues early on .
- Test and Iterate: As with any design process, testing and iteration are key. Use data trees to isolate different parts of your design and test them independently. This approach helps you identify and fix issues more efficiently.
Data trees are a powerful tool in the computational designer’s toolkit, offering a structured and efficient way to manage complex data. By mastering data trees in Beegraphy, you can enhance your design process, solve problems more effectively, and create more sophisticated and refined designs. Remember, the key to success with data trees is planning, organization, and iteration. With these best practices in mind, you’re well on your way to unlocking the full potential of computational design.