Settings
Every model setting of the BeeGraphy Editor lives in one Settings modal. This page walks through each tab: what it controls and what you will see in it.
Open the Settings modal
There are two ways to open the Settings modal:
- Click the Settings (gear) button 12 at the bottom-right of the 3D viewer. See the viewer toolbar.
- Open the main menu in the upper-left corner of the Editor and choose Settings.
The tabs are, in order: General, Appearance, 3D Viewer, Export, Scenes, Layer, Scopes, Materials, Services, Measurement, Machines, Hardware, Thumbnail, and Manifest. Each one is described below.
General
The model itself and how the canvas and its panels behave.
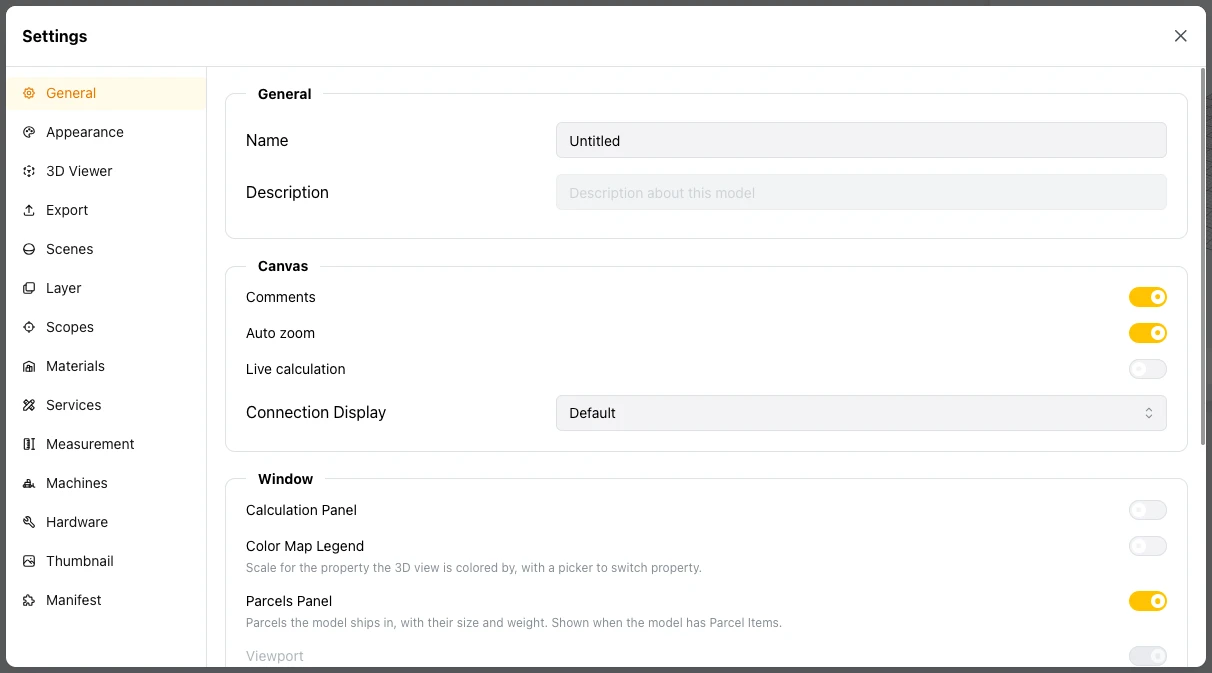
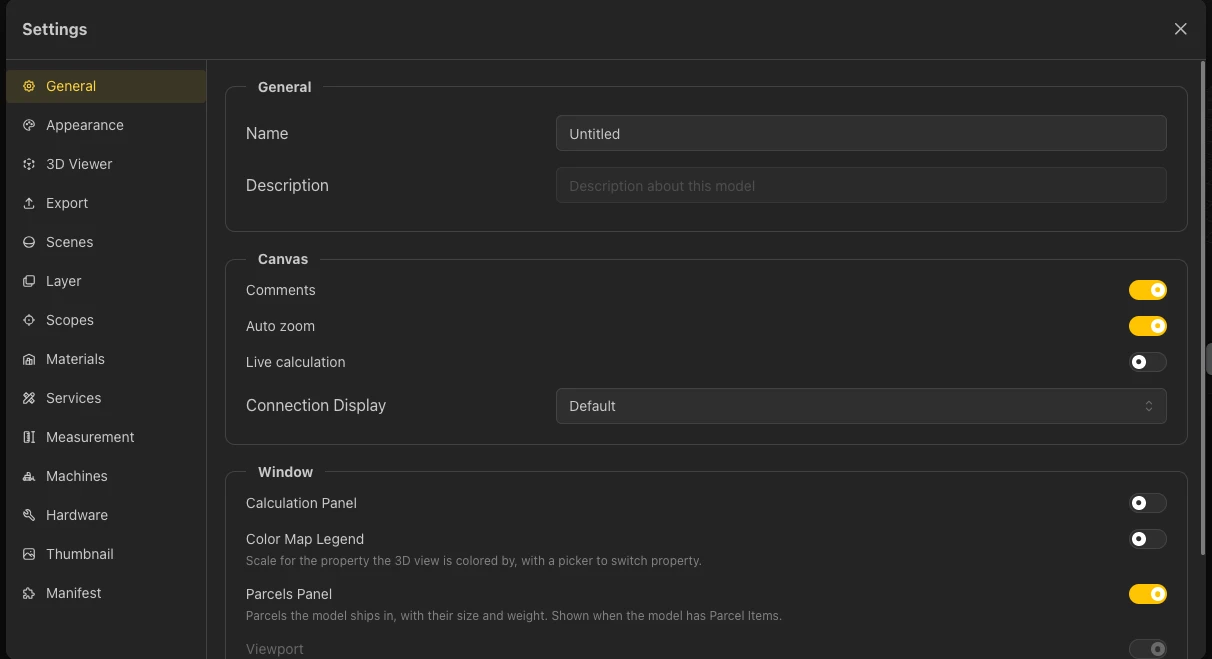
Settings, General tab
- Name and Description: the name and the description of the model.
- Canvas: the options Comments, Auto zoom, Live calculation, and Connection. With Auto zoom on, the graph view zooms in to the selected node when you pick its geometry in the 3D viewer.
- Connection: chooses how wires are drawn - Default, Wireless, Faint, Linear, Step, or Bump. Wireless connections show an indicator on both ports.
- Window: the options Calculation Panel, Color Map Legend (the scale for the property the 3D view is colored by, with a picker to switch property), and Parcels Panel (the parcels the model ships in, with their size and weight; shown when the model has Parcel Items).
- Viewport Debugging: Show node execution time. The Debug Timing item of the main menu relates to this option.
Appearance
How the Editor itself looks.
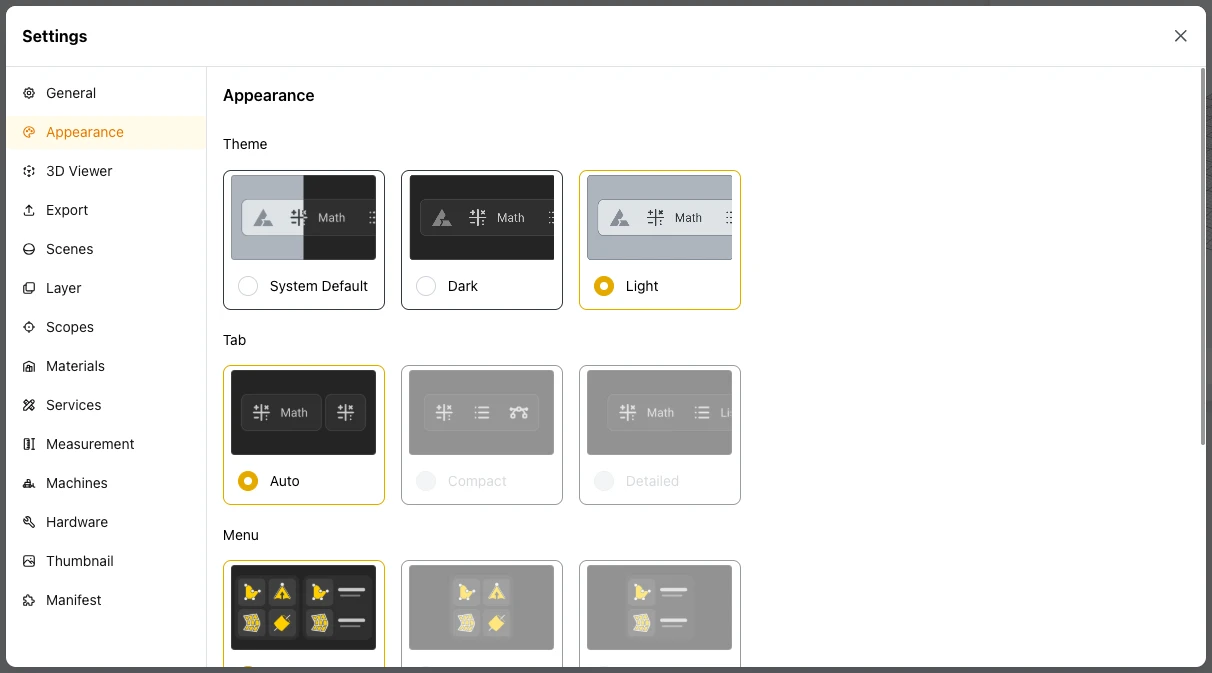
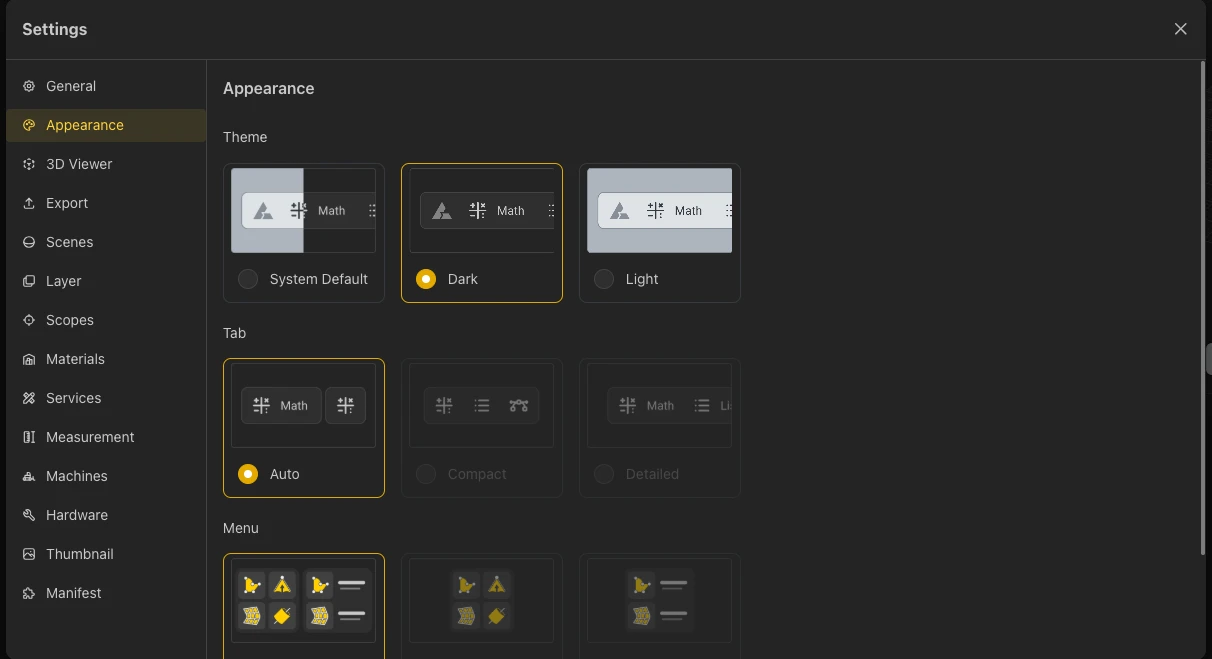
Settings, Appearance tab
- Theme: System Default, Dark, or Light.
- Tab: the tab style - Auto, Compact, or Detailed.
- Menu: the menu layout - Auto, Grid, or List.
3D Viewer
How geometry is represented in the 3D viewer. These settings affect visualization only - they do not impact the final output or exported files. The 3D View page describes them in context.
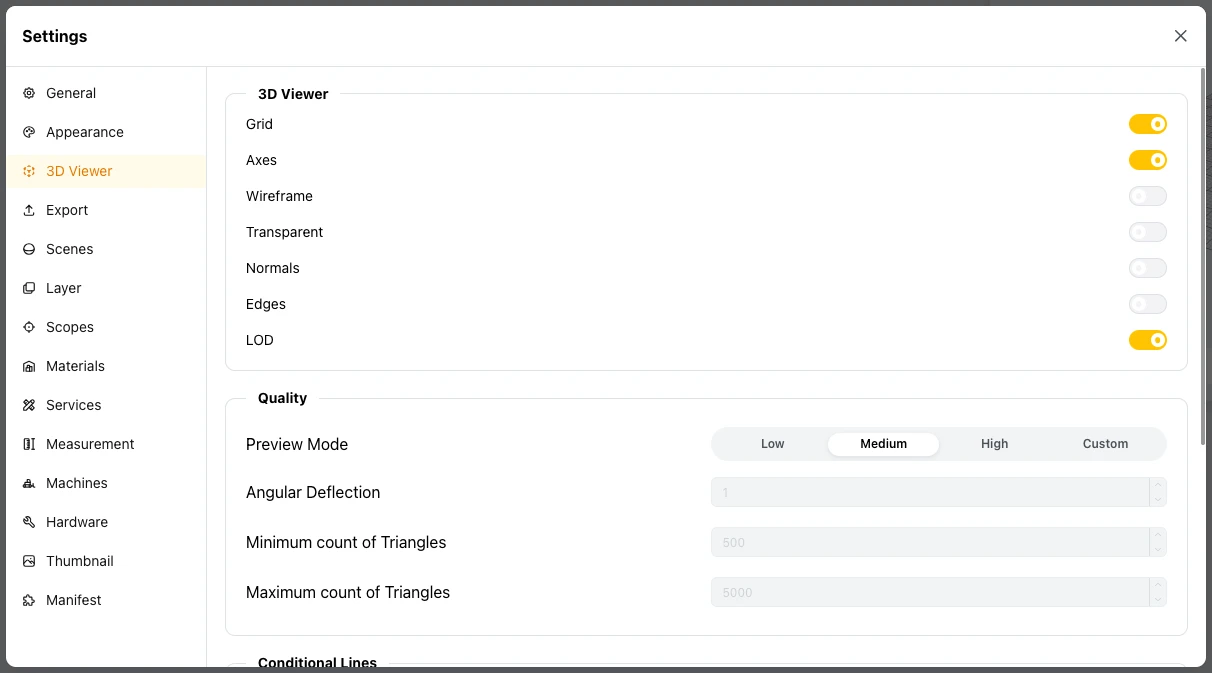
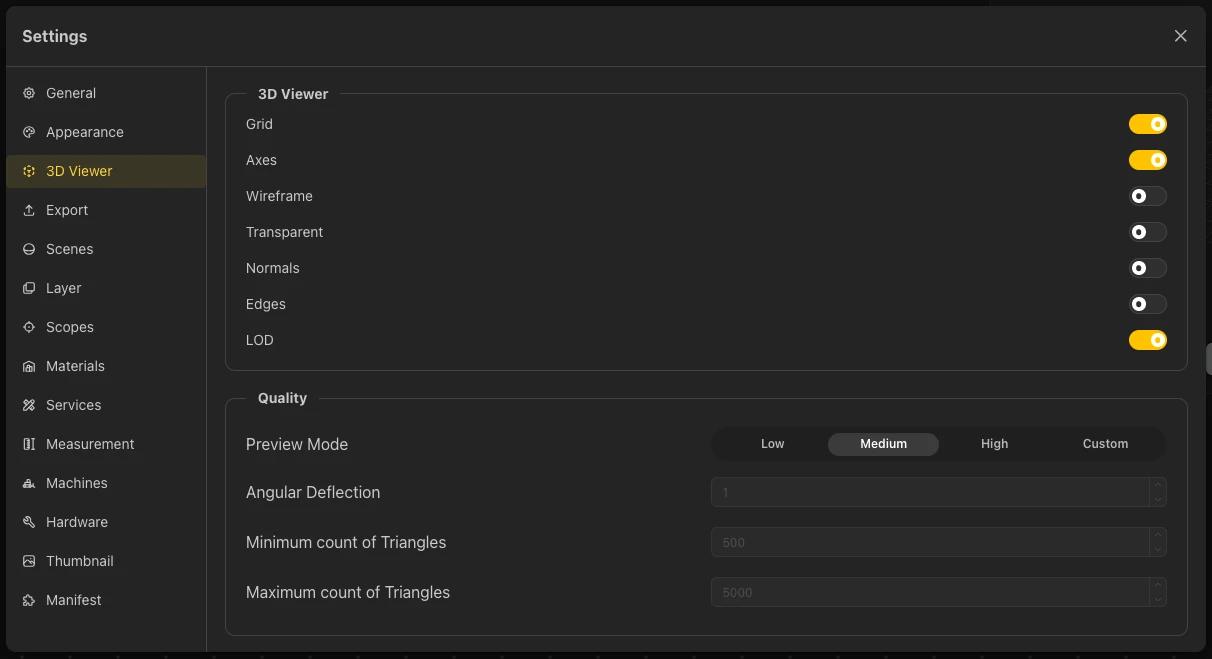
Settings, 3D Viewer tab
- Grid: the reference grid (XY plane).
- Axes: the X, Y axis display.
- Wireframe: display the geometry in mesh/wireframe form.
- Transparent: make geometry see-through to inspect internal parts.
- Normals: visualize the directions of surface normals.
- Edges: highlight sharp and feature edges for clarity.
- LOD: level of detail - geometry is rendered at different levels of complexity depending on camera distance.
- Quality: Preview Mode is Low, Medium, High, or Custom. Choose Custom to edit the Angular Deflection and the Minimum and Maximum count of triangles yourself.
Export
The export settings of the model. The Export dialog in the main menu shows the same fields.
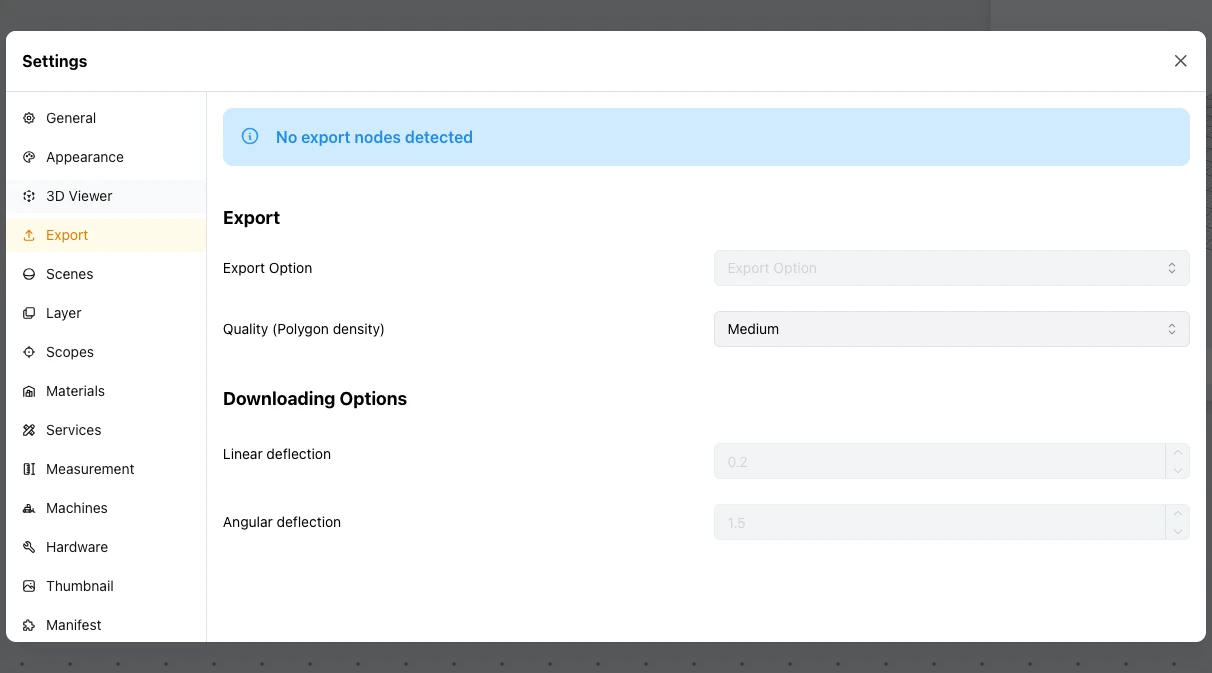
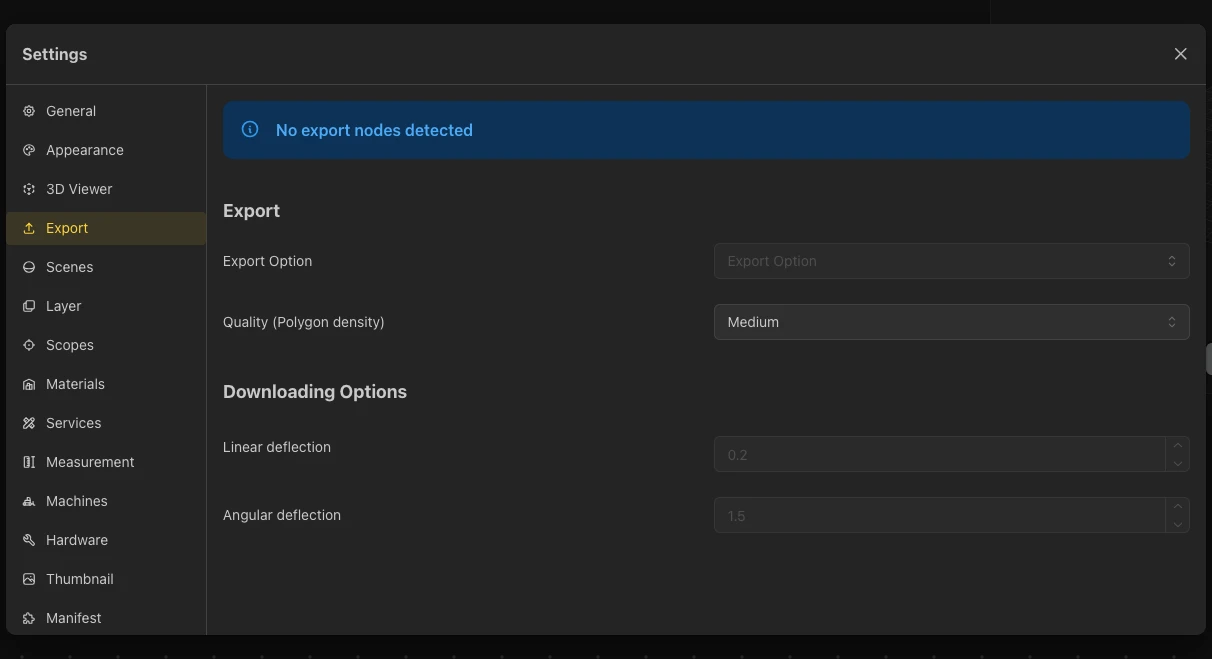
Settings, Export tab
- Export Option: a select field for the export.
- Quality (Polygon density): how dense the polygons are, for example Medium.
- Downloading Options: the Linear deflection and Angular deflection used for downloads.
- When the graph has no export nodes, the tab says No export nodes detected.
Scenes
Pick the environment for the 3D viewer. The tab lists public HDRI environments, such as Studio Brown Photostudio, Pretoria Gardens, Rogland Clear Night, Docklands, and Park Music Stage, and a separate list for your private HDRIs.
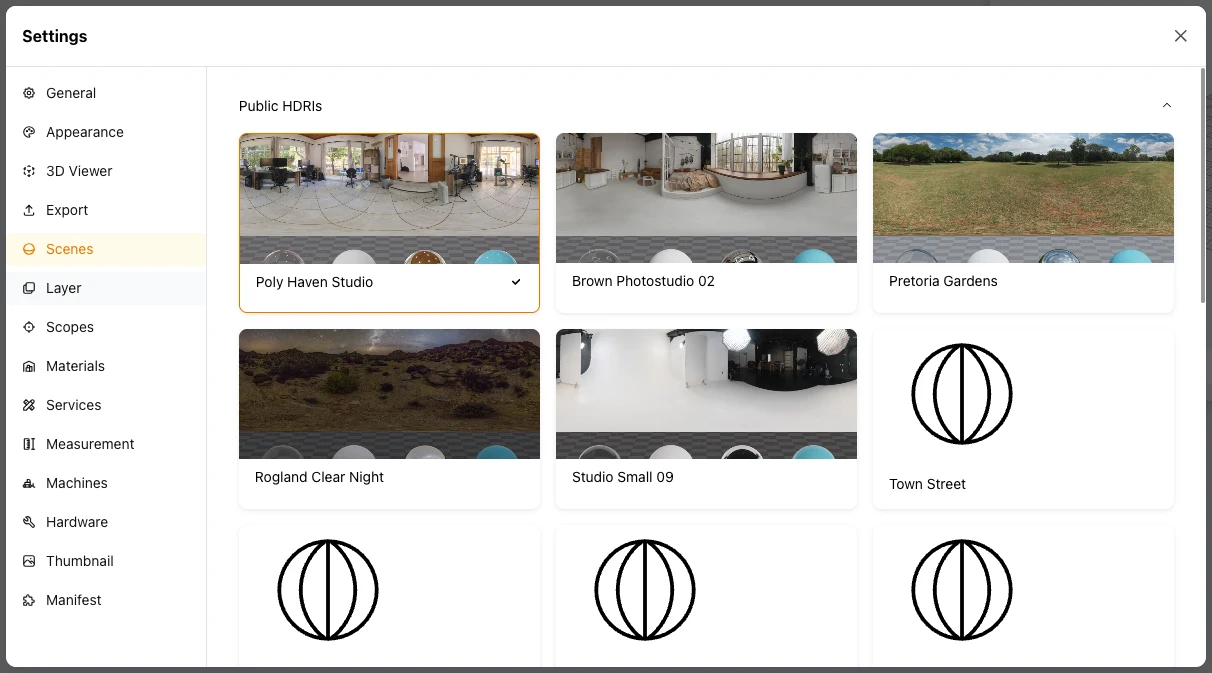
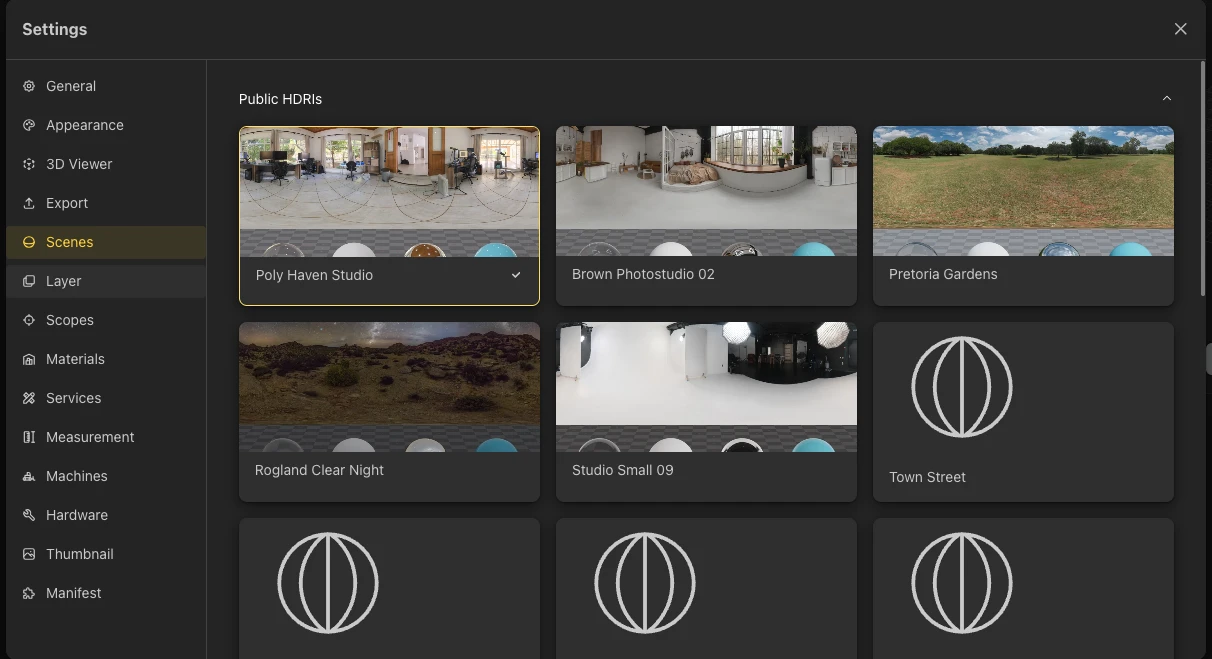
Settings, Scenes tab
Layer
Color-coded layers. The tab shows a General Rules table with the columns Color, Operation, RGB, and Description, which maps each color to an operation. The CAM Viewer uses these layers for cutting, marking, engraving, and internal cutting.
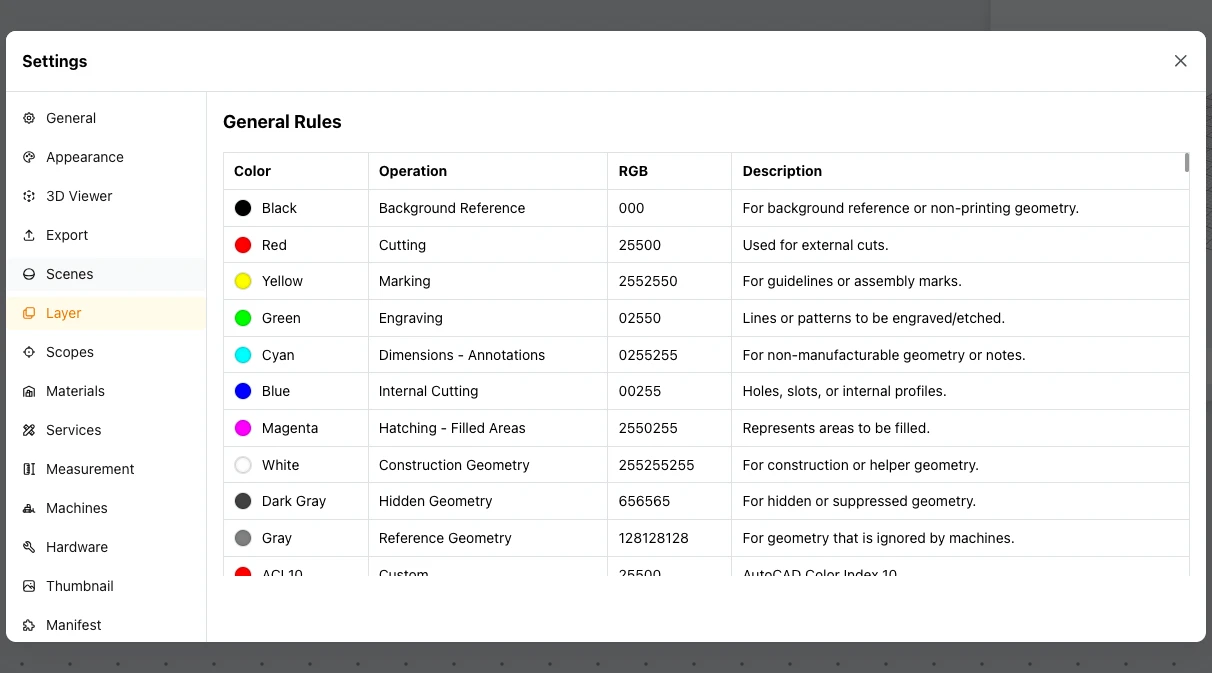
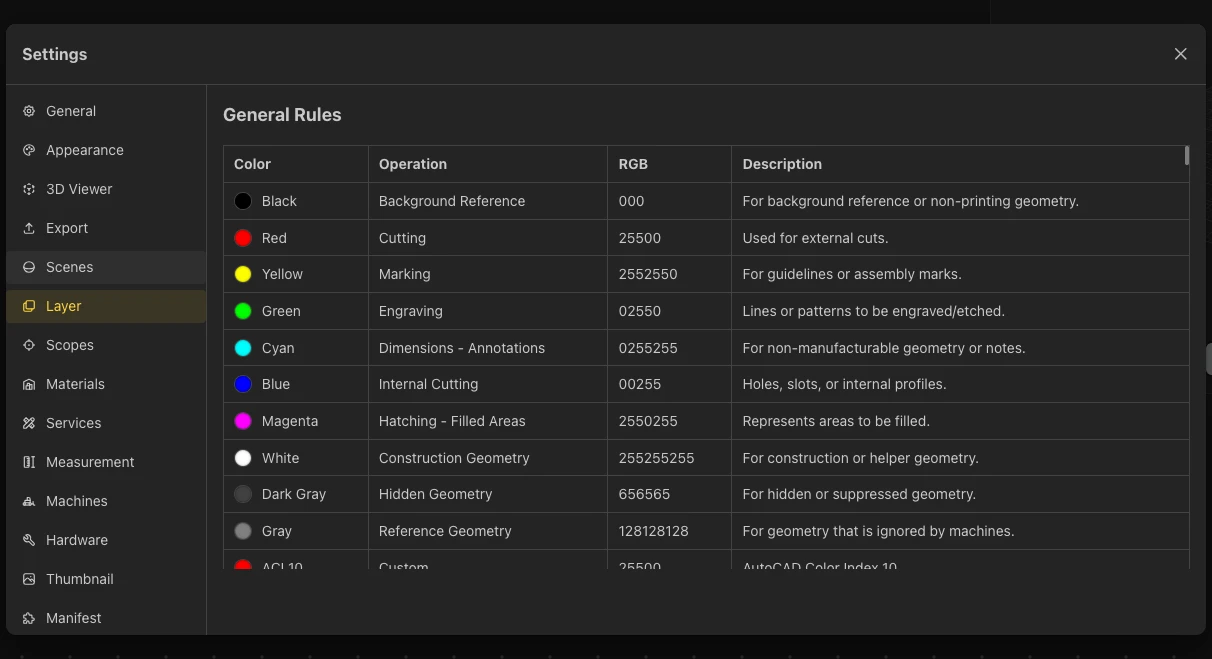
Settings, Layer tab
- Black: Background Reference
- Red: Cutting (external cuts)
- Yellow: Marking (guidelines or assembly marks)
- Green: Engraving
- Cyan: Dimensions - Annotations
- Blue: Internal Cutting (holes, slots, internal profiles)
- Magenta: Hatching - Filled Areas
- White: Construction Geometry
- Dark Gray: Hidden Geometry
- Gray: Reference Geometry
Scopes
Scopes choose which nodes run for the live preview, for export, and for CAM. The tab has its own page - see Scopes.
Materials, Services, Machines, and Hardware
These four tabs follow one pattern: each lists the matching nodes found in your graph. A model with no matching nodes shows a note instead.
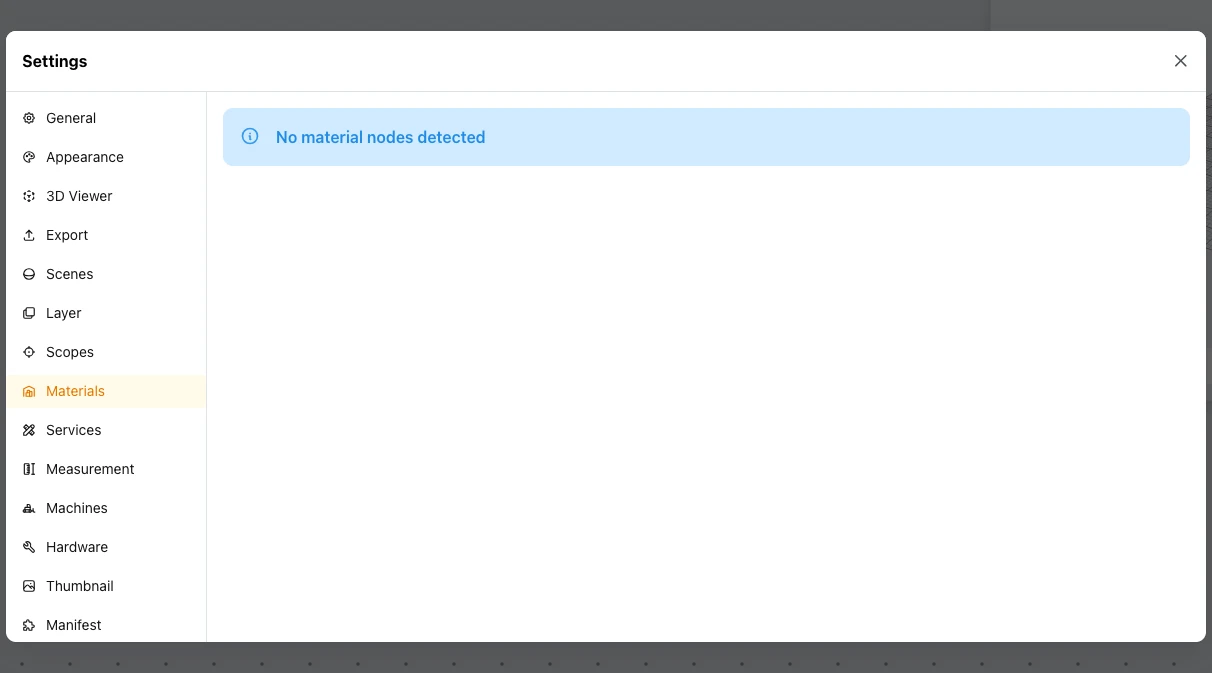
Settings, Materials tab. The Services, Machines, and Hardware tabs are laid out the same way.
- Materials: the material nodes in the graph, or "No material nodes detected".
- Services: the service nodes in the graph, or "No service nodes detected".
- Machines: the machine nodes in the graph, or "No machine nodes detected".
- Hardware: the Hardware nodes. When none applies it says "No Hardware node matches more than one Hardware".
Measurement
The units the model uses.
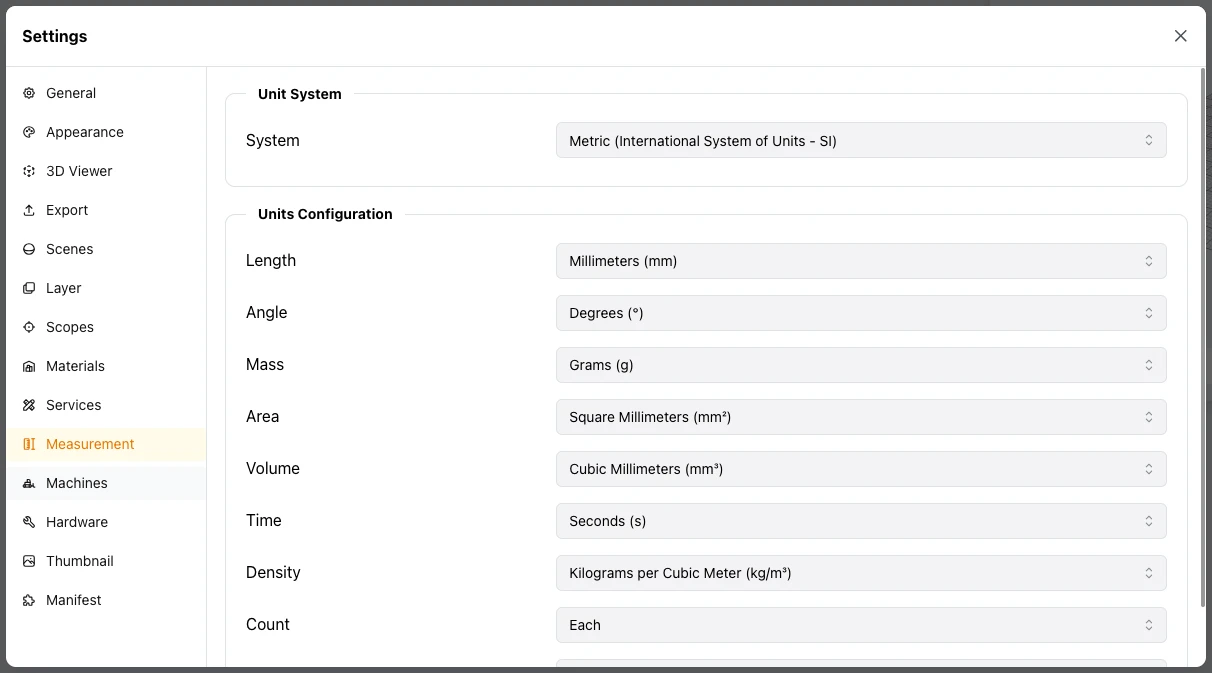
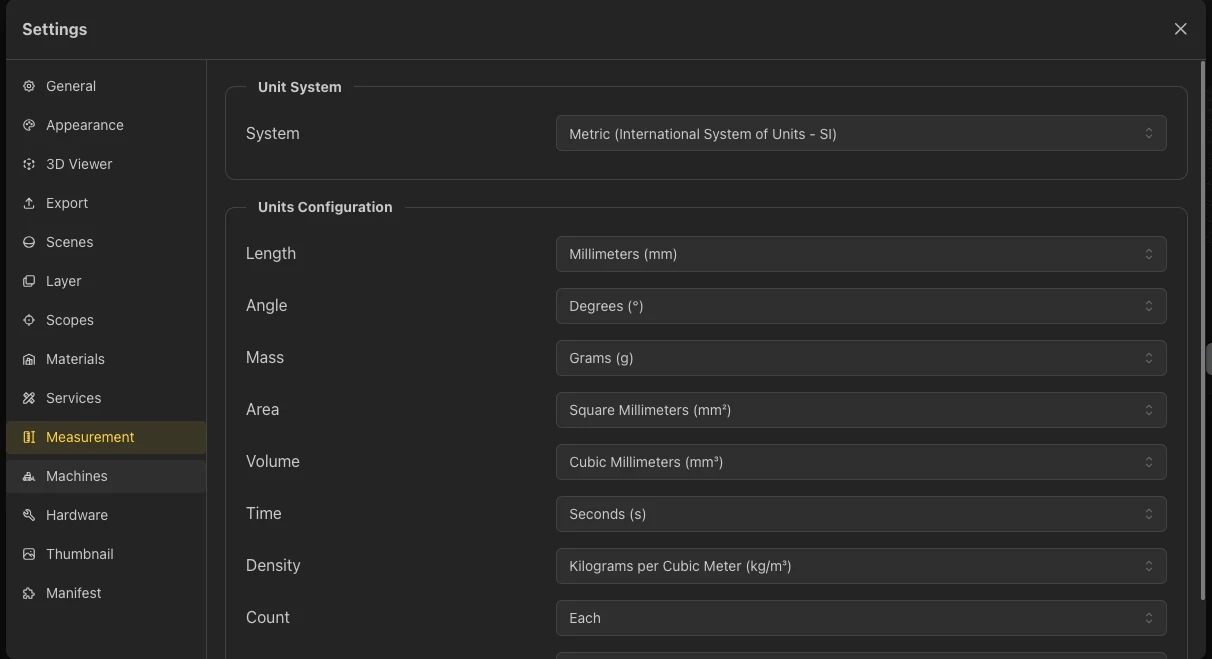
Settings, Measurement tab
- Unit System: Metric (SI) or United States Customary (USCS).
- Units Configuration: the unit used for each kind of value - Length, Angle, Mass, Area, Volume, Time, Density, Count, and Temperature.
Thumbnail
The thumbnail of the model. You can also generate it from the thumbnail button of the 3D viewer: left-click generates it, right-click opens its settings.
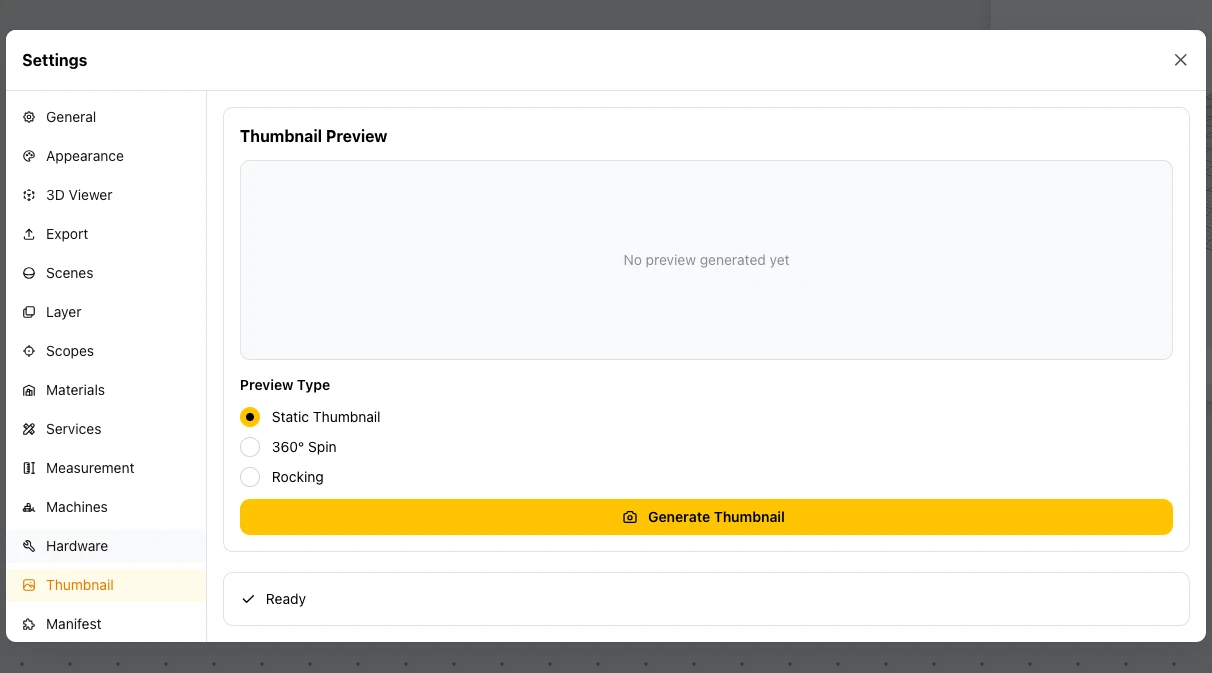
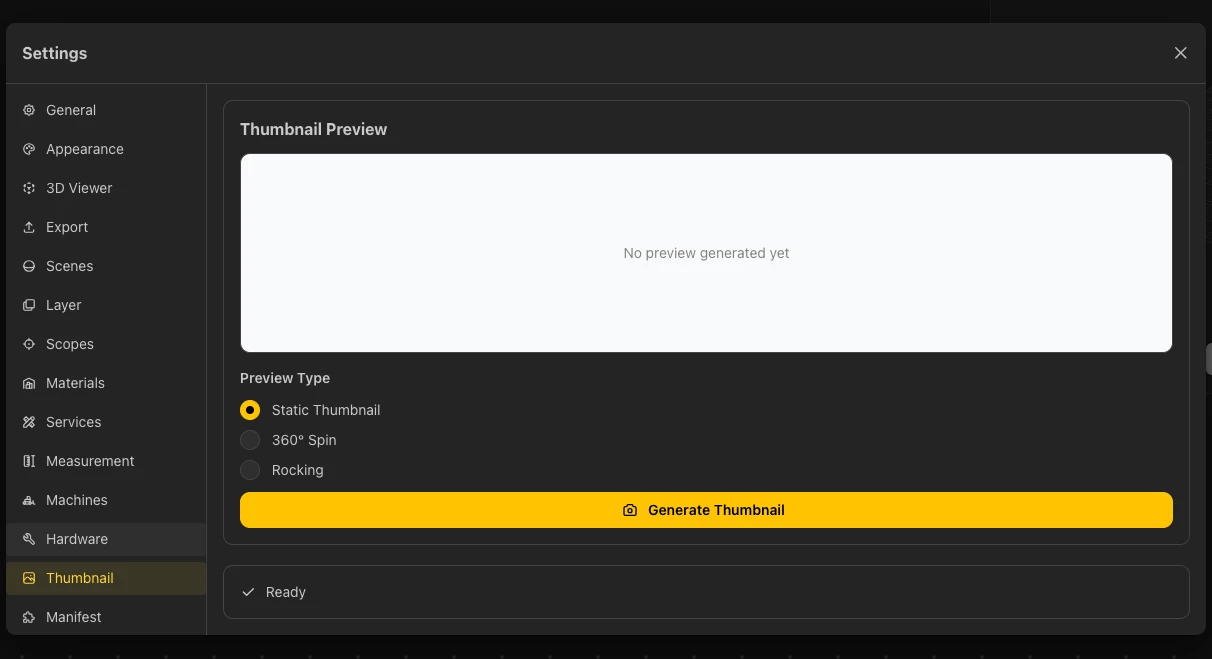
Settings, Thumbnail tab
- Thumbnail Preview: the current thumbnail, or "No preview generated yet".
- Preview Type: Static Thumbnail, 360° Spin, or Rocking.
- Generate Thumbnail: creates the thumbnail. A status line shows its state, for example Ready.
Manifest
The manifest controls which plugins, assets, and materials the model uses. It has three sub-tabs: Plugins, Assets, and Materials.
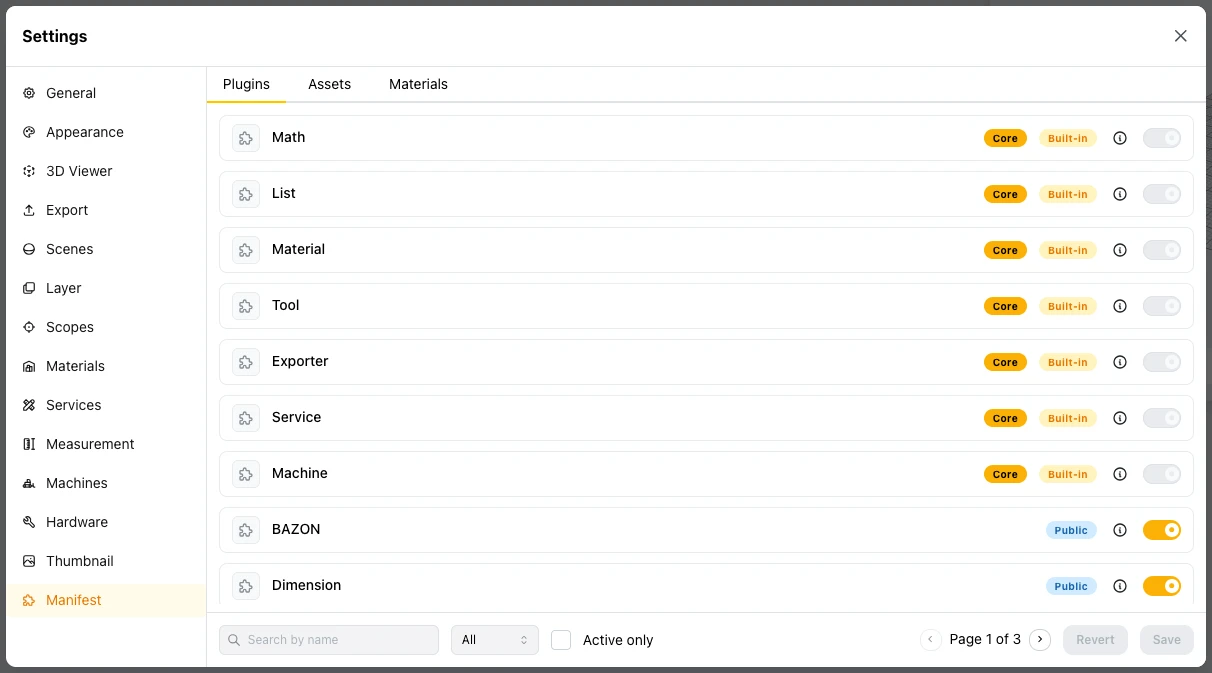
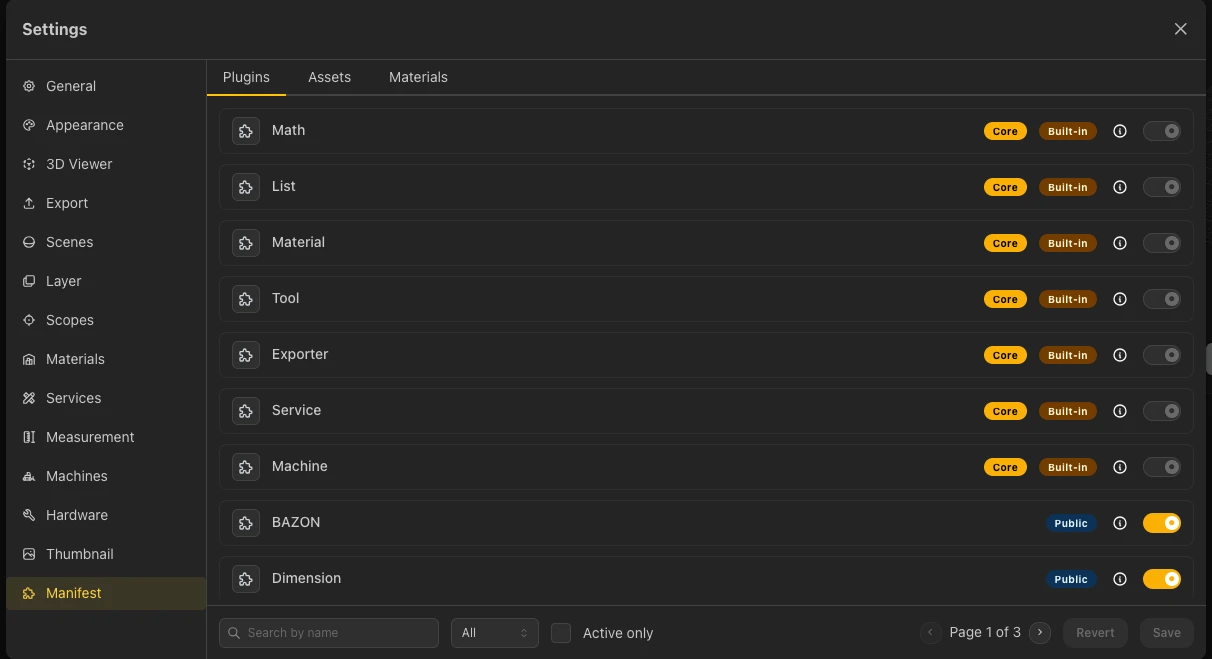
Settings, Manifest tab
- Plugin rows: each row has a badge (for example Core and Built-in, or Public), an info icon, and a toggle.
- Find a plugin: search by name, use the filter (All), or switch on Active only. The list is paginated.
- Revert and Save: the tab has a button for each, so you can discard or keep your changes.
Learn More
BeeGraphy Editor
The Editor layout, main menu, and canvas controls
→
3D View
The viewer toolbar, display modes, and camera positions
→
Scopes
Choose which nodes run for preview, export, and CAM
→
CAM View
G-code toolpaths for CNC and laser cutters
→